Lodgenet (LNET) – Unattractive despite very high free cash flow

April 21, 2011

As you may know, my favorite metric for evaluation a company is its ability to generate free cash flows. However, it is dangerous to focus entirely on that issue to the exclusion of other important aspects of a company. I will explore this issue by examining Lodgenet (LNET), a company with free cash flow through the roof, but with certain offsetting characteristics that make it an unattractive prospect to me.
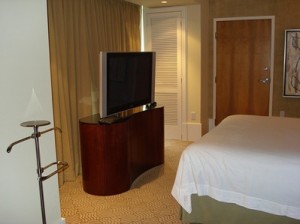
Lodgenet’s business is providing media and connectivity on demand in hotels, and they are also expanding into hospitals. The majority of the company’s revenue comes from guest on-demand movies, including what are described in the SEC filings artfully describe as “independent films, most of which are non-rated and intended for mature audiences”. Lodgnenet also provides ordinary cable programming and broadband Internet service, which it supplements with advertisements.

The company’s numbers are phenomenal; in 2010 the firm’s free cash flows were $50 million, although because much of that comes from excess depreciation, the firm’s earnings power would be about $32 million if excess depreciation was taxed. Lodgenet has 10% preferred stock outstanding, which has a prior claim of nearly $6 million per year, and I shall have more to say about the preferred stock later. Even so, the company’s market cap is only $90 million, so depending on which tax treatment is chosen, the company has a free cash flow yield of 30.3% under the high tax scenario, or 48.9% under the low tax scenario. In other words, in a little over three years, based on current earnings power, Lodgenet would earn a purchaser enough in free cash flow to pay off the shares.

But could it, really? I am concerned that this may be too good to be true. Lodgenet’s sales have been declining for some time, and the firm has a massive debt position that raises concerns about interest coverage and covenant compliance. The preferred stock that I mentioned was issued in June of 2009 in order to equitize a portion of Lodgenet’s debt (as well as provide some anti-takeover provisions) and there was a stock offering in 2010 that had the same effect, although the firm claims that part of the proceeds were used for capital spending as well. In the first quarter of 2011 Lodgenet also refinanced its debt agreement, expanding its permitted leverage ratio from 3.5 to 4 and reducing its interest coverage ratio from 3x to 2.25x in exchange for an increase in interest rates, which are estimated to be 6.5% (5% plus LIBOR, or plus 1.5%, whichever is higher) on a forward-looking basis, apart from a brief spike next quarter before Lodgenet’s swaps expire.

Furthermore, 2010’s capital expenditures, at $22 million, are well below the five-year average levels of $47 million. Now, as is stated in Benjamin Graham’s Security Analysis, a company can only be said to have earned money if it has made sufficient capital expenditures to maintain its earnings power. Damodaran, in his useful toolkit Damodaran on Valuation, reminds us that there can be a distinction drawn between maintenance and growth capital expenditures, with the latter having a sort of optionality attached to it. However, most corporations do not divide the two types of capital expenditures in their reports, and even if they did, the companies have a vested interest in making the growth category as large as possible, both because it makes free cash flows look better and because investors like growth. And of course, it is a distinction without a difference in many cases, as the money is spent either way. Therefore, the wise approach is to take the conservative view that all capital spending is maintenance capital spending.

However, owing to the declines in Lodgenet’s sales and operating cash flows, we do not have this luxury of choice; it is clear that levels of capital spending are below replacement levels, as the lower than average capital expenditures for the last few years may indicate, as would the lowered amounts of actual hotel rooms serviced (1.8 million as of the first quarter 2011 as compared to 1.98 million in 2008). It may be that, like Mac-Gray, Lodgenet is shedding its lower-margin clients, and indeed Lodgenet is focusing on expanding its high-definition offerings, but that too may require more capital than current spending would indicate.

So, enough of dancing around the figures; let us examine them. In 2010 sales were $452 million and reported operating earnings were $23 million.  Depreciation was $83 million and capital expenditures were $22 million. This produces excess depreciation of $61 million, which makes operating cash flow $84 million. Interest expense that year was $34 million, leaving pretax cash flow of $50 million, or $32 million after estimated taxes. Taking out $5 million for preferred stock dividends leaves $27 million in estimated free cash flow to common shareholders.

In 2009, sales were $463 million and reported operating earnings were $22 million. Depreciation was $100 million and capital expenditures were $21 million. This produces excess depreciation was $79 million, which makes operating cash flow $91 million. Interest expense that year was $38 million, leaving $53 million in pretax cash flow, or $36 million after taxes. Taking out $6 million in preferred stock dividends (they did not actually incur this expense, but for purposes of calculating future earnings power we should take it into account), we have $30 million in estimated free cash flow to common shareholders.

In 2008, sales were $534 million and reported operating earnings, apart from a goodwill impairment charge, were $6 million. Depreciation was $124 million and capital expenditures were $64 million. This produces excess depreciation of $66 million, which makes operating  cash flow $66 million. Interest expense that year was $42 million, leaving $24 million in pretax cash flows, or $16 million after estimated taxes. After the preferred stock dividend, this leaves $10 million in after-tax free cash flows.

In 2007, sales were $486 million and reported operating earnings were $-4 million. Depreciation was $116 million and capital expenditures were $79 million (not including acquisitions made that year). This leaves excess depreciation of $43 million, producing operating cash flows of $39 million. Interest expense that year was $41 million. Of course, this was the company’s first year operating on such a large scale, and also the year in which they borrowed the money to pay for the acquisitions that is now causing the firm so much trouble.

As we see, much of the improvements in 2009 and 2010 in terms of free cash flow are owing to the lower capital expenditures in these years as compared to 2008 and 2007. In fact, if capital expenditures were at the five-year average levels from 2006-2010, which is $47 million, there would be hardly any free cash flow to shareholders, apart from the tax benefit of excess depreciation. It may be that Lodgenet’s business calls for a large initial investment and then lower maintenance expenditures, but considering the short lifespan of Lodgenet’s capital assets (the company took $75 million in depreciation charges in 2010 on $206 million in property and equipment from 2009’s closing balance sheet, producing a weighted average life of 2.75 years), I would not bet on it. Lodgenet has been using its free cash flow to common shareholders, including the tax benefit from the excess depreciation, more or less exclusively to pay down debt.

The company released its first quarter 2011 earnings last night (which is why this article wasn’t published two days ago). We can see more of the same trends at work; sales were $107 million, down from 118 million for first quarter 2010. Reported operating earnings were $6.9 million, depreciation was  $19.6 million and capital expenditures were $4.6 million, producing cash flow from operations of $21.9 million, as compared to $24.2 million for first quarter 2010. Interest charges were $7.7 million, as compared to $8.7 million for first quarter 2010, leaving $14.2 million in pretax cash flows, or $9.2 million afterwards. Taking out $1.4 million in preferred stock dividends leaves $7.8 million in free cash flow to common shareholders. The comparable figure for first quarter 2010 is $8.7 million. I am hesitant to draw too many conclusions from these results, particularly as capital expenditure levels can vary over the year and the firm spent only $4.6 million on capital expenditures while management suggested in its earnings call that capital expenditures for the full year of 2011 would be in the $25-30 million range–which itself is higher than in 2010 and 2009, further biting into free cash flow.

So, on top of the diminution in earnings, I find that we are once again confronting our paradox of valuation, that a company in the process of deleveraging can increase its value based on free cash flow  over a given period by less than the amount it actually earns in the same period. Here, it is clear that debt is a problem at Lodgenet, as shown by the two equitization moves and the necessity of renegotiating the debt. As of the company’s last report, its long-term debt stood at $360 million, with the firm able to devote an estimated $50 million per year towards paying it down ($29 million in free cash flows as estimated, plus $21 million in estimated tax benefits from excess depreciation). Lodgenet claims, and not without justification, that the amended credit agreement has bought the company some breathing room, but with cash flows on the decline and capital expenditures at below replacement levels anyway, it is not apparent to me that the debt issue is safe.

So, is Lodgenet ultimately a value investment? I should say no. The difficulty is that although I can see that capital expenditures are below maintenance levels, I do not therefore know what the correct level of capital expenditures would be, making it impossible for me to calculate free cash flow. As a result, I cannot estimate how many years it may be necessary for Lodgenet to devote substantially all of its free cash flow towards debt repayment (the new credit agreement requires 75% of excess cash flow to be directed to that purpose for the lifetime of the agreement), which renders the free cash flow multiple approach impossible (as funds required to be used to pay down debt are definitely not “free). Nor am I satisfied that the debt of Lodgenet, even with the new credit agreement, is safe from default, or more likely, from having to make further concessions in a renegotiation.

Therefore, despite the apparently attractive free cash flow yields of this company, there are far too many unknowns present for me to be able to say that there exists a definite margin of safety or a low probability of ultimately losing money, and I would advise passing on Lodgenet at present. Even though purchasers of this company can (and most likely will, now that I’ve spoken against it) reap  great rewards from this firm, I do not feel there is anywhere close to enough assurance of the same.

0

Consolidated Communications (CNSL) – Strong dividends and excellent cash flow

April 18, 2011

I have often found compelling values in rural telephone companies, such as Windstream and Qwest (now acquired by CenturyLink, as they throw off large amounts of free cash flows and are kind enough to produce dividends. My latest discovery in this area is Consolidated Communications (CNSL), which pays 8.4% and which has a free cash flow yield of 11.4% after excess cash is taken into account, based on last year’s results. Unlike Windstream and Qwest, Consolidated uses wireless partnerships to offset loss of traditional customers, as well as high speed Internet, which adds a further level of stability.

I have also reexamined my views of excess depreciation and amortization: Although it is wise to run the calculations first treating the excess depreciation as taxable, and to place significant weight on that calculation, it may be helpful as well to make a reasonable, conservative projection of the actual present value of the tax benefits associated with excess depreciation. Of course, as with all projections, this one is unlikely to be ultimately accurate and one should avoid using only this measure to justify an investment, but the projection must still be of interest to investors.

For my full views on Consolidated Communications, please visit http://seekingalpha.com/article/264006-consolidated-communications-a-strong-candidate-for-dividend-investors

2

Domtar (UFS) – A paper company with strong cash flows

April 6, 2011

Since my last foray into the paper industry with Boise Inc., I thought it would be appropriate to review the rest of the sector. After some searching, I have settled on Domtar (UFS).  Domtar is the largest producer of uncoated freesheet paper in North America, and also a producer of wood pulp, with operations in several locations in the United States and Canada. The company was formed in 2006 to purchase Weyerhaeuser’s fine papers division, which transaction was consummated in May of 2007. Obviously, the timing of the deal was not the best, as the firm has had to recognize significant goodwill and asset impairments since that event. However, these impairments are noncash expenses, and Domtar has produced an attractive record of free cash flows since the acquisition, with free cash flow yields of above 11% even during the difficult 2008-2009 period. Also, the company has on its balance sheet over $500 million in excess cash, out of a market cap of $3.85 billion.

Furthermore, Domtar has not shied away, as many acquirers do, from the usually necessary process of whittling down of unneeded or underperforming assets following an acquisition. In fact they have shut down several underperforming paper mills in Mississippi, in Saskatchewan, Ontario, and Quebec, and in California. The company has also repurposed its plant in North Carolina to produce purely fluff pulp in response to market demand. Finally, the firm has sold off its wood and lumber products business since the acquisition. In fact, as recently as last week Domtar announced the closing down of a papermaking line at its plant in Arkansas.

As a result, the company has been able to maintain a high level of free cash flows throughout the 2008-2009 period despite a lowering of demand, and 2010 was a dramatically impressive year for Domtar, with free cash flows of $583 million, equal to almost 1/6 of the firm’s entire market cap. However, this may be the result of a fortunate confluence of circumstances, where sales prices increased without the cost of inputs catching up and therefore the 2010 results are perhaps atypical. Domtar has recently been using its impressive free cash flow to pay down its debts, having paid back $917 million in 2010 and $400 million in 2009.

Turning to the figures, I would first like to address the excess cash level. A common measure of a firm’s excess cash is the total cash and investment on the books, minus the extent to which current liabilities exceed current noncash assets. (Of course, cash being described as “excess” does not mean that a company could instantly declare a special dividend of all of its excess cash without its liquidity suffering; it merely means that a purchaser of a company’s stock is allocating part of his or her purchase price to cash that is not encumbered by any pressing need. Therefore, the purchaser may be said to “claw back” that amount from the purchase price, while the remainder is allocated to the actual capital assets of the business. A business that is strongly cash flow positive (and as a value investor, those are the only kinds of business I like investing in) may be expected to produce the cash to address its noncurrent liabilities out of its future earnings, and the extent to which the company’s prospects indicate that they can do it governs whether the excess cash as calculated is really excess, which in Domtar’s case I believe it is. This analysis also requires a determination that a company’s debts are manageable, which again is true in Domtar’s case; interest is covered over four times in each of the last four years surveyed).

For Domtar, based on its latest balance sheet, the firm has $530 million in cash and $1.47 billion in noncash current assets (of which $1.25 billion consist of receivables and inventories, rather than the more nebulous categories of “deferred taxes” and “other”), set against $725 million in current liabilities. As a result, noncash current assets exceed noncash liabilities and therefore all $530   million in cash may be considered excess. Taking $530 million off of the market cap of $3.85 billion leaves $3.32 billion representing the market value of Domtar’s capital assets.

In terms of earnings, in 2010, Domtar’s sales were $5.85 billion and operating earnings as reported came to $603 million. However, because of noncash impairments resulting from plant closures, and other closure- and restructuring-related costs, $77 million in expenses should be considered noncash and/or nonrecurring. This produces $680 million in income from operations, which, after interest expenses of $97 million, leaves $583 million in pretax earnings, or $379 million applying a 35% tax. (In fact, Domtar reaped a tax windfall in 2010 and 2009 for operating loss carryforwards and a tax credit for black liquor, a byproduct of producing paper pulp that makes an excellent fuel and which qualified for an alternative fuel subsidy from the US government in 2009. However, the subsidy has expired, and for purposes of forecasting Domtar’s earnings power, it would be preferrable to apply the statutory, rather than the historical, tax rate).

Furthermore, as with many companies, Domtar has an additional source of free cash flow in that its depreciation charges of $395 million have exceeded its capital expenditures of $153 million. This leaves $242 million of additional cash flow to Domtar’s owners, producing total free cash flows to equity of $583 million. This represents a free cash flow yield of 17.6% based on the $3.32 billion market value of Domtar’s operating assets. This source of free cash flow is presently untaxed, although eventually the gap between depreciation and capital expenditures may be expected to resolve itself at which point this will no longer be the case. However, Domtar is still in the process of whittling away at its underperforming assets to increase its competitiveness and therefore the current levels of capital expenditures may be considered reasonable for longer-term estimates. Therefore, at the current rate of capital expenditures the gap will take many years to close, during which time the excess depreciation will continue to be tax-free.

For 2009, sales were $5.47 billion and reported operating earnings were $615 million. However, this was the year of the black liquor tax credit, which contributed $497 million in nonrecurring extra income, which was offset by $125 million in impairment and restructuring charges. Therefore, actual operating earnings were $243 million, before interest expenses of $121, leaving $122 million in pretax earnings, or $79 million after taxes. Excess depreciation that year came to $299 million, producing free cash flow of $378 million.

For 2008, sales were $6.39 billion and reported operating earnings were $-437 million, but this year included noncash and/or nonrecurring impairments and restructuring charges of $751 million, producing actual operating earnings of $314 million, before interest expenses of $132 million, leaving $182 million in pretax earnings, or $118 million after taxes. Excess depreciation in that year was $300 million, producing free cash flow of $418 million.

Domtar’s acquisition of Weyerhaeuser’s fine papers division occurred in May of 2007, but the firm was kind enough to include pro forma earnings in its 2008 10-K. For 2007, sales were $5.95 million, reported operating earnings were $270 million, before $31 million in noncash or nonrecurring events, producing actual operating earnings of $301 million. Interest expense that year was $142 million, leaving $159 million in pretax earnings, or $103 million after earnings. Excess depreciation that year came to $355 million, producing $458 million in free cash flow.

In 2006, Domtar’s business was still inside Weyerhaeuser, and curiously the financial reports do not allocate any interest expense to it. At any rate, sales were $3.31 billion and reported operating earnings were $-556 million, before noncash or nonrecurring impairments and other items of $701 million, leaving $145 million in actual operating earnings, or $94 million after taxes. Excess depreciation came to $247 million, producing $341 million in free cash flow.

2010 2009 2008 2007 2006
Sales 5850 5465 6394 5947 3306
Reported operating income 603 615 -437 270 -556
Impairments, restructuring & other nonrecurring 77 -372 751 31 701
Operating income 680 243 314 301 145
Interest expense 97 121 132 142 0
Pretax earnings 583 122 182 159 145
After-tax earnings 379 79 118 103 94
Excess depreciation 242 299 300 355 247
Free cash flow 583 378 418 458 341

So, what can we take away from these figures? The paper industry is a cyclical industry, and, according to Damodaran in his useful toolkit, The Dark Side of Valuation, it would be unwise to base our valuation on the most recent year even if it was not an unusually good one, but to look at the performance over a broad cycle. Unfortunately our data do not cover an entire business cycle. However, I would say that 2010 was a very good year, with sales increasing 7% and cost of sales actually declining 1%, according to the firm’s 10-K, a situation that may not continue through 2011 and thereafter in an environment of rising costs. By contrast, 2009 was no doubt a period of unusually weak demand owing to the financial crisis and its aftermath (although in 2009 the firm still produced $378 million in free cash flow, which, when set against the $3.32 billion price the market is setting on Domtar’s capital assets, is still a free cash flow yield of 11.4%).

If I had to pick a single figure for Domtar’s earnings power, I would say that it lies between those two extremes. At any rate, if we average the 2007-2010 free cash flows we get $459 million per year, which, set against the $3.32 billion market cap after removing excess cash, produces a yield of 13.8%, which I find very attractive.

I conclude, then, that Domtar has strong earnings power and as long as its management can continue to adjust to changing economic conditions by adapting its productive capacity, it should continue to produce high levels of free cash flows for its owners. As such, I can recommend as a portfolio candidate.

2

Dell: Tons of cash, tons of cash flow

March 21, 2011

Dell, although not a company that fires the imagination, has a market cap of 28 billion, of which 12.5 billion consists of cash and investments that the company does not seem to particularly need. Dell’s free cash flow, not counting investment income, came to 2.86 billion last year, representing a yield of 18.5%. Dell will be increasing capital expenditures next year, which may cause the free cash flow yield to decline to the 2.5 or 2.6 billion area, in order to continue their strategy of modest growth. I wouldn’t rely on growth, but I’ll definitely take the amazing yield.

For my full analysis, see

http://seekingalpha.com/article/259200-dell-boring-company-exciting-numbers

0

Moody’s downgrades River Rock Entertainment Authority bonds: Too soon to be Concerned

March 18, 2011

Several of my readers have written me requesting my opinion on the recent downgrade of the River Rock Entertainment Authority casino bonds that fall due November of this year. The effect of this downgrade has pushed the price of the bonds from the 94 range to the 88 range based on recent prices.

I found the text of Moody’s downgrade announcement, and it stated that the grounds for the downgrade were the lack of significant progress on refinancing and the casino’s other financial obligations such as the emergency access road they are required by their agreement with Sonoma County to construct. Taking the second one first, it is true that River Rock agreed to build the road in 2008 (and to complete construction by 2009, but you know how things are with construction), and that they have escrowed $4.3 million in cash out of their total cash holdings of $43.6 million for the purpose of completing it. I hope that the delay in construction has not imperiled the casino’s relations with Sonoma County, but if the estimate of remaining construction costs is close to accurate, the casino should be able to absorb the cost without difficulty, as according to my previous estimates the casino generates roughly $30 million per year of free cash flow, of which only $11 million is officially distributed to the Tribe.

The refinancing issue is perhaps more troublesome, and Moody’s announcement that there has been a lack of progress is frightening for the markets in that it is ambiguous. A “lack of progress” could mean simply that the River Rock Entertainment Authority has not been active in contacting investment banks to get the refinancing done, in which case they may want to get moving. I don’t know how long it takes to analyze, issue, and sell a bond issue of this size, but I suppose that as the deadline is known and the refinancing is important to River Rock, that it is not too early to expect forward movement.

The more sinister interpretation is that River Rock has been shopping the deal around and had difficulty drawing the interest of investment banks, which could mean that the casino might be forced into higher interest rates or more restrictive covenants. If this is the case, I would attribute it more to the perception of the weakness of the gaming industry as a whole than anything specific to River Rock; as I calculated in my initial recommendation of the bonds, free cash flow covers current interest expenses by roughly three times, which I consider reasonably safe.

Although it is true that there is a competing casino proposed 30 miles south of the casino along the same route that gamblers from the Bay Area would take to get to the River Rock casino, that new competitor is is still in the planning and permitting stage and there are months or years of legal wrangling involved (including the fact that the proposed new site encroaches on the habitat of an endangered newt) before construction can even begin, and at any rate the new casino might not siphon off as many customers as investors fear. Furthermore, River Rock generates significant cash flow in excess of tribal distributions, one solution might be that the new bonds could be given an amortization provision so that the load of interest and principal requirements are cut to what the market would perceive as a more manageable level by the time the new casino is expected to begin operation.

Another issue I have with the Moody’s report is that it apparently assumes that the loss from default will be 50%. I consider this estimate to be completely baseless: not only do the casino’s current cash flows appear adequate to its current interest requirements forever, but they also have no basis from which to calculate the extent of the loss. No Indian casino has ever tested the bankruptcy process, and because only an Indian tribe can hold an interest in a casino, the usual result of a bankruptcy where a class of creditors becomes the new equity holders is unavailable, thus injecting an unwanted level of uncertainty into the situation. As a result, I think a default would be somewhat less painful for the bondholders, particularly as River Rock has recently been building up cash on its balance sheet perhaps in anticipation of being able to float a smaller bond issue.

I should also point out that Moody’s may be drawing upon information has not been made public yet; River Rock’s last 10-Q appeared in the middle of November 2010, and they did not release their annual report until March 31 last year, so it could be that the market is simply overreacting in the absence of updated information. When the annual report is finally released this year, I will read it with interest and it might move me to be more concerned. But as things stand, the downgrade itself does not strike me as particularly significant.

21

Mac-Gray (TUC) – Cheap stocks live in the strangest places

March 10, 2011

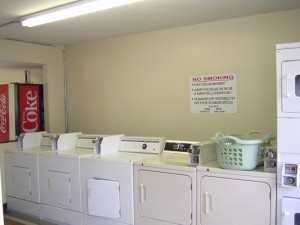
As I generally adopt a bottom-up investing policy, and go into investing without any preconceived notion of what sector my stocks are going to be in. As a result, I am often surprised at the odd niches where attractive stocks hide. However, Mac-Gray Inc. (TUC) is one of the more unusual ones. They operate laundry facilities in any buildings large enough to require them, including apartment complexes, college dorms hospitals, and hotels and motels. They are the biggest single provider of services in college residences. Generally they lease the space and provide it with laundry equipment, while the property owner is responsible with cleaning, maintaining, and security.

As their leases run for multiple years, they tend to have a captive audience of users, and as a result they display fairly decent earnings resilience, although they claim that a decline in apartment occupancy owing to the financial crisis has affected their recent results. On the whole they claim to have generally no difficulty in renewing their leases, and that usually they are the ones who decline to renew based on a lack of profitability. They are also in a position to somewhat pass higher costs on to consumers.

Yesterday morning they reported earnings that were consistent with their previous performance, and the market did not greet this with approval, sending them down more than 6%. The day was generally bad for the markets, but they may have been reacting to slightly higher administrative expenses and a spike in capital expenditures in the company itself. On the whole, I am sort of pleased with this outcome of earnings; I’ve had this article being planned for days, but I didn’t want to recommend it before a disruptive event like earnings, so I held off on it. This exposes me to the risk that the company gets a good response from earnings, forcing me to abandon it as a value proposition. It’s one of the reasons I hate earnings season, and this one particularly has seen my stocks being punished by the market even if they produce respectable and estimate-beating earnings. I take it as a sign that there is perhaps too much optimism in the market right now.

Mac-Gray’s reported earnings are not so impressive, but recently their depreciation has been running higher than capital expenditures for the last few years, partly owing to recent large acquisitions and partly because they have been bleeding off some unprofitable contracts. They also lease equipment to customers who do not want to become full clients. The company is continuing in its efforts to pay down their debts incurred for the acquisitions.

Turning to the figures, in 2007 operating earnings were $17.1 million, depreciation was $38.7 million and capital expenditures were $26.7 million, producing $29 million in operating cash flows. They paid $13 million in interest, producing $17 million in pretax free cash flow. Owing to the fact that much of their free cash flow was depreciation, they only paid $0.7 million in taxes that year, producing free cash flow of $16.3 million.

In 2008, operating earnings were $20.5 million, depreciation was $48.8 million owing to a large acquisition, capital expenditures not counting the acquisition were $24.3 million, giving operating cash flow of $44.9 million, which is more like it. Interest incurred that year was $20.6 million, leaving $24.2 million in pretax cash flow. That year they actually received a tax refund of $0.8 million, producing $25 million in free cash flow.

In 2009, operating earnings of were $21.1 million, depreciation was $49.9 million, and capital expenditures were $21.3 million, giving us operating cash flow of $49.6 million. Interest was $19.7 million, and final operating cash flow was $30 million. Taxes paid that year were $1.3 million, leaving $28.7 million in free cash flow.

For 2010, based on their earnings announcement, operating income was $18.4 million owing to lower margins and a small decrease in sales, depreciation was $47.5 million and capital expenditures came to $28.6 million, producing operating cash flow of $41.3 million. Interest paid in 2010 was $13.4 million, owing partly to some favorable interest rate swap movements, producing pretax free cash flow of $28.9 million.  Taxes paid that year $2.2 million, producing free cash flow of $27.7 million. The company now has a market cap of $204 million, which represents a free cash flow yield of 13.6%, with interest covered 3.08 times.

I am aware that I often calculate cash flow arising from excess depreciation as though it were taxable, as it gives a better clue as to long term earnings power, but here the excess depreciation is so large relative to earnings that I prefer to give the figures as they are because it seems that there will be a long time before earnings and depreciation will converge, so the firm will have significant tax-free income for some time. If the free cash flow is entirely subject to tax, the company would produce free cash flow of roughly $17.4 million.

In the latest conference call, TUC mentioned two interesting facts. First, they anticipate that sales for 2011 will be more or less identical to 2010’s sales, and that they anticipate capital expenditures to rise to the area of $33 million, which will no doubt cut into free cash flow. They also, and very helpfully, announced a useful tidbit that they estimate $28 million to be their “maintenance” level of expenditures, meaning that counting unrenewed contracts that must be replaced, $28 million per year is roughly what they need to maintain earnings power. This would suggest that the bleed-off of contracts as shown by capital expenditures being below $28 million in 2008 and 2009 has apparently come to an end and they anticipate actual expansion in 2011. As a result, the company may show some long-term growth in future years. I am of course hesitant to rely on such growth, but even without it, it would appear that company’s earnings from the same level of operations next year will be on par with those from this year and as a result the investment stands without it.

On the whole, then, the stability in operations that Mac-Gray has demonstrated, the slow improvement in occupancy rates that they see, the continued paying down of debt incurred to make acquisitions, places this company within the increasingly rare set of value propositions in this market, and I can recommend it for portfolio inclusion.

1

United Online (UNTD): Cash flows stabilizing at a good price

March 7, 2011

I have discussed United Online several times on this site, and noted that it has apparently attractive dividends and free cash flows, but that the loss of a post-transaction marketing program has affected their free cash flows in such a way that a prudent investor should wait and see how they regain their traction.

As it happens, my concerns were somewhat exaggerated, as the free cash flows for United Online have been hovering around $17 or $17.5 million per quarter pretty much ever since the post-transaction program was suspended, even though dial-up revenues and revenues from United Online’s classmates.com property have declined and capital expenditures have increased somewhat as the result of classmates.com rebranding itself into memorylane.com, a general nostalgia site. As a result, the company has a price/free cash flow yield of an impressive 13.8% which seems sustainable at least for the moment, although the success of the rebranding is still up in the air.

For my full opinion on United Online, please see

http://seekingalpha.com/article/256076-united-online-strong-free-cash-flow-makes-for-an-attractive-valuation


0

RR Donnelley (RRD): Possibly the Last Cheap Stock in the Market

February 23, 2011
Tags: ,

It is only natural that the stock market, having doubled since the March 2009 low, would seem to be running a little short on bargains. And I have a sense, based on purely anecdotal observations, that optimism in the market has reached a local peak in that companies have been punished by the market for putting out respectable, even expectation-beating quarterly earnings. And, of course, then, something in Libya happens and hundreds of billions of dollars of paper wealth have to disappear.

But I have to take the position that whatever is going on in the broader markets, there must be a few bargains out there to go along with all the new overinflated short candidates. One such stock is RR Donnelley (RRD), the largest printer in the country. The printing industry, of course, is under economic pressure, as fewer people are interested in advertising and catalogues, and also under secular pressure from the decline in print directories and the rise of e-books (although the firm claims that their book printing volumes have not been affected by them yet). As a result, RR Donnelley’s sales and free cash flows have declined over a few years. But what has declined more is their share price, moving them into bargain territory. The company, whose debt position is sound and which is rolling up smaller printers in order to reduce what they call “overcapacity” in the sector, now offers a free cash flow yield of 13.3%, when its sales and free cash flow are showing signs of stabilizing. They also offer a generous dividend yield of 5.5%.

My full opinion of RR Donnelley may be found here.

http://seekingalpha.com/article/254219-r-r-donnelly-strong-free-cash-flow-attractive-valuation

I heartily recommend this company as a candidate for portfolio inclusion.

0

Sinclair Broadcasting (SBGI) – Everything’s Good Except the Price

February 17, 2011

One of the great debates among fundamental investors, whether they are value investors or whether they should be value investors, is the question of bottom-up or top-down. The top-down approach involves examining the economic outlook, the state of the financial markets, and the trends among the sectors, in order to determine the best stocks in the best sectors, taking into account the markets and the economy. The proponents of this view look upon this method as providing three additional checks on the right decision. The bottom-up investors describe it instead as three more ways to make a mistake. Furthermore, what if the economy points one way and the market points another, as is often the case? What if the sector is richly priced but an individual stock has been left behind? Most value investors definitely fall into the bottom-up category, and so do I.

However, I have considered my habit of finding companies that come in pairs, and as such I am willing to concede that if a particular stock is attractive, then other similar stocks are at least worthy of consideration. I suppose you could call it the mountain climbing approach: bottom to top to bottom. In that vein, I thought I would examine Sinclair Broadcasting Group (SBGI), which, like Belo Corp, is a geographically diverse television broadcaster that has  suffered from large noncash impairments and is now seeing stabilization in its operations that is allowing it to deleverage.

Sinclair Broadcasting owns 58 stations in 35 markets, most of which are network affiliates. The company has also chosen to diversify into various other ventures, such as a television broadcasting equipment company, a security alarm service provider, a sign maker, and some real estate speculations. Damodaran, in his Damodaran on Valuation, concludes that the market tends to punish diversified companies and that investors are more or less capable of diversifying on their own, particularly where, as here, there is hardly any possibility of vertical integration. As a result, the market was cheered when the company announced recently that they would be divesting some of its noncore assets, as well as reinstating its dividend. Their bonds, though rated firmly in the junk area, trade roughly at par. Their debts are still ample, and I can see them devoting much of their free cash flow towards paying them down in future, dividend or no.

Apart from large goodwill writeoffs, they have been profitable for the last five years, and revenues have recovered since the 2008 and 2009 slump, assisted by political advertising.  Sinclair’s current market cap is $1.04 billion, which, as I shall calculate later, is approximately 13 times their annual free cash flows, which I would not consider cheap, particularly as those cash flows may be earmarked for debt repayment and as such, under a curious paradox of valuation methods, may not be considered free.

The following is my estimate of their free cash flows. Like many companies in the current economy, Sinclair Group has been able to produce some excess depreciation. Their free cash flows have been remarkably stable despite the economic volatility. As for their 2010 year to date figures, the company has reported that 2010 was an excellent period, buoyed by the Super Bowl, a rebound in automotive advertisements, and an unusually vitriolic election season. However, they have not published the full set of financial statements, and also such a good quarter may serve to distort rather than inform our investment views, so I have not included it.

2010 ytd. 2009 2008 2007
Sales 542 656 754 718
Reported operating income 159 -111 -288 159
Noncash or nonrecurring expenses:
Goodwill/license impairments 0 250 463 0
Excess depreciation 3 36 15 57
Other nonrecurring gains 0 5 3 0
Adjusted operating cash flow 162 180 193 216
Net interest expense 88 80 87 100
ASC 470-20 effect* 4 9 10 6
Net interest expense and interest coverage ratio 84, 1.93x 71, 2.54x 77, 2.51x 94, 2.30x
Pretax free cash flow 78 109 116 122
After 38% tax rate 48.36 67.6 71.9 75.6

*ASC 470-20 requires companies that issue convertible debts that may be settled in cash, of which Sinclair Group has three separate convertible issues,  to record the value of the convertible debt in two pieces, the debt component based on the value of a similar nonconvertible debt, and the equity component being the remainder of the face value of the bonds. This equity component must be amortized over the life of the convertible bonds, and most companies record this amortization as an interest expense. I have already made my views on this accounting rule clear: This rule obscures, rather than clarifies, financial statements, requires companies to record an expense that does not exist to amortize an asset that never existed, and does not even appropriately value the conversion privilege, which should be assessed using option pricing, because of its linear assumptions and complete disregard of price movements; the conversion price of the bonds is above 20 and the current share price of Sinclair Group is a mere 12 and change.

At any rate, I expect full year 2010 results apart from the unusually good political advertising season to be somewhere in the mid to high 70 million in free cash flows. If we call it 77, that is a free cash flow multiple of 13.5x, or a yield of 7.4%. As I stated, the company has also announced the resumption of its 48 cent per year dividend, which will consume $38.5 million per year, leaving $40 million per year to pay down debts with. Considering that Sinclair Group has over $1.1 billion in debts, and their interest coverage is somewhat worrisome at roughly 2x, they may be working at debt repayment for some time.

So, where does that leave us? Sinclair Broadcasting has a fairly robust operation and a debt level that is high but manageable, and has shown recent improvement in its operation–not that the wise value investor would project any kind of trend from these improvements. However, the price to free cash flow yield for the company is too high, in my view, especially considering that some of their free cash flow is to be used to pay down debt, which has a comparatively low after-tax return. Other than that, it is in much the same situation as our attractive-looking Belo Corp,  and if there is a significant pullback in prices (unlikely in the current market but still possible if some of the optimism is bled out), it should constitute a very attractive purchase. But as things stand, the price is too high.

0

Cisco (CSCO) – A Gift from the Markets

February 10, 2011

I have over the last few months been forming the conclusion that Cisco offers an attractive potential return situation based on its earnings yield from operations. The company, with a market cap of $105 billion, is sitting on $35 billion in excess bonds because the CEO is unwilling to repatriate its overseas profits under the current tax scheme. Take those away, and we find that Cisco’s core operations produce some very juicy returns.

Last night, Cisco reported reasonable earnings and announced that its future growth is not at an end. Regular readers will know what I think about future growth, but Cisco is reasonably priced without it and a screaming buy with it. The market inexplicably punished Cisco with a 13% decline in share prices today, which I would describe as nothing short of a gift for new purchasers.

I have my full views on Cisco on my seekingalpha page at http://seekingalpha.com/article/252139-cisco-looking-beyond-results-from-a-single-quarter. Do please come by.

0