Gaming Partners International (GPIC) – An attractive opportunity in casino suppliers

July 1, 2011
Tags: ,

The comparisons between Wall Street and a casino predate the current financial situation by decades. I, of course, have an interest in casinos of all kinds, as shown by my approval of various Indian casino bonds. And now, I have found an enticing opportunity in a casino supplier.

Gaming Partners International (GPIC) is the largest supplier of casino products. Its biggest product by far is casino chips, which represent roughly 2/3 of total sales. The company’s premier product line is chips embedded with RFID devices to enable easy counting and tracking, and of course to identify counterfeit or stolen chips with ease. Gaming Partners is the exclusive licensee of the major technology behind these chips, although the patent does expire in 2015. The company also holds several other patents pertaining to chip production.

The firm’s other product lines include quality playing cards, casino furniture and table layouts, dice, and accessory products like card shufflers and, interestingly enough, a device that can be integrated into casino tables that blows the smell of customers away from dealers (a vital service, as most casinos allow smoking).

The company reports that its future growth opportunities may be constrained, as new casino openings, which require a large consignment of chips, are likely to diminish in these uncertain times, and of course casinos are, like anyone, attempting to stretch out the lifespan of their current capital allocations. It is unfortunate, then, that playing cards, which have a lifespan of twenty-four hours, or dice, which have a lifespan of only eight, do not represent a larger proportion of the company’s total sales than the 8% and 4% respective proportions that they do now. However, in the first quarter of 2011 the company achieved very attractive results from a large contract from the Galaxy Macau casino, which opened in May of this year.

Turning now to the figures, Gaming Partners’ balance sheet is highly attractive. Out of a market cap of $59 million, the company boasts $30.7 million in cash and securities. The company’s noncash assets total $16.3 million. The current liabilities include $7.1 million in debts that fell due in June and a further $6.7 million in accrued liabilities, mainly salary. Taking these away from the cash position leaves $16.9 million. The other current liabilities consist of $2.8 million in accounts payable and $3.2 million in customer deposits (meaning that the Gaming Partners already has the money and now has to perform on its contracts to recognize the income). At any rate, these current liabilities are well covered by noncash current assets, meaning that the remaining $16.9 million in cash and securities may be considered excess. This means that the market value of Gaming Partners’s capital assets is $42 million.

In terms of income, Gaming Partners’ sales for fiscal year 2010 were $59.9 million. Reported operating income was $6.4 million, and excess depreciation was $1 million, producing operating cash flow of $7.3 million (due to rounding). After interest expense of $23 thousand, we are left with $7.3 million in pretax free cash flows to equity, or $4.8 million after estimated taxes of 35%. This represents a free cash flow yield on capital assets of 11.4%. Of course, it should be noted that this calculation treats the excess depreciation as taxable when legally it is not. This would serve to raise the free cash flow for the year by $0.3 million.

In 2009, sales were $49.5 million, and operating income (net of a goodwill impairment) was $2.8 million. Excess depreciation was $1.4 million, producing operating cash flow of $4.1 million. After interest expenses of $102 thousand, we have $4 million in pretax cash flow, or $2.6 million after taxes.

In 2008, sales were $60.5 million, operating income (net of impairments) was $5.5 million, excess depreciation was $1.1 million, producing operating cash flow of $6.6 million. After interest of $137 thousand, we have pretax cash flow of $6.4 million, or $4.2 million after taxes.

In 2007, sales were $58.8 million, operating income was $0.9 million, and in this year capital expenditures exceeded depreciation by $0.2 million, producing operating cash flows of $0.7 million. After interest of $190 thousand, the company produced $0.5 million in pretax income, or $0.3 million in after tax income.

In 2006, sales were $74 million, and operating income was $8.5 million. Capital expenditures were high this year, exceeding depreciation charges by $2.8 million, producing operating cash flow of $5.7 million. Interest expense came to $175 thousand, leaving $5.5 million in pretax cash flow, or $3.6 million in free cash flow.

It does seem that Gaming Partners has been able to reduce its capital expenditures in accordance with the current level of business. Furthermore, the $7.1 million in current debts I mentioned above constitutes the last major piece of debt that the company has outstanding, and SEC filings do not suggest any intention to issue new debt. There is a further complication in the form of expiring patents and licenses, although I should point out that the company initially valued its intellectual property at only $915 thousand, so it may be that the company’s profitability may spring from other advantages than the patents.

At any rate, if the current level of capital expenditures can be maintained, or would increase only in response to increased demand, Gaming Partners offers a free cash flow yield that makes it an attractive candidate for portfolio inclusion.

0

What should we do about changes in working capital when calculating free cash flow

June 22, 2011

In my last article at seekingalpha.com on the dramatically low price of Best Buy (BBY), it was pointed out to me by a commenter that I have a nonstandard definition of operating cash flow. Specifically, when calculating a company’s operating cash flow, and consequently free cash flow, I ignore changes in working capital as a source or sink of cash.

I do not recall consciously choosing to ignore this category of the cash flow statement. Obviously ignoring versus not ignoring it can produce significant divergence in a company’s free cash flow. But, having had this tendency pointed out to me, I naturally examined the literature and my own investment philosophy to determine whether my view of changes in working capital is reasonable. I concluded that changes in working capital can often, but not always, be set aside.

The first reason why changes in working capital can be set aside is that my goal in performing a valuation is to arrive at a reasonably conservative estimate of a company’s earnings power, and changes in working capital are often temporary. An increase in inventory in one quarter can be offset by the sale of inventory in the next quarter, and payables incurred in one year may be paid off in the next. In consequence, we have not lost the cash invested into working capital in the first period, but only the interest on it. By according too much attention to changes in working capital, the earnings power of a company is made to look more volatile than it is. Of course, Ben Graham’s advice in his Security Analysis is to perform a multi-year analysis rather than placing undue emphasis on the performance of a single year or single quarter. This may resolve this matter without recourse to more complicated modes of analysis.

Even without taking reversibility of working capital changes into account, some categories of changes in working capital are inherently nonrecurring. Changes in working capital in one year are often in no way tied to the changes that occurred last year, or will occur next year. If, say, a retailer makes a deal with its suppliers that it can buy inventory on 90 days’ credit instead of 60 days’, this will produce a dramatic influx of cash in the form of increased payables. However, it would be unwise to infer from this that in the next accounting period, the company will be able to expand its payables to 120 days. Therefore, this source of cash flow would be ignored in calculating a company’s long term earnings power (although it would be taken into account in calculating a firm’s excess cash, obviously).

The second reason I choose to set aside changes in working capital is that working capital is not consumed in the manner that fixed capital is. If, for example, a business invests $3 million in a piece of machinery that has a lifespan of three years, then at the expiration of three years the business is left with a pile of scrap metal. If, however, a business invests $3 million in inventory and receivables, and spends three years selling inventory, collecting receivables, paying down payables, and (hopefully) having cash left over, then at the end of the three years it should have $3 million in working capital, apart from the usual vagaries of obsolete inventory, bad debts, and so on. Working capital, then, if managed correctly, does not wear out. That is why there is generally no depreciation allowance given for it. And, as I said above, an increase in working capital in one year does not imply that there will necessarily be a similar increase in working capital in any future years. This is not true for fixed capital, which requires continuous replenishment. That is why I count excess depreciation as a source of cash flow, and capital spending in excess of depreciation as a cash sink.

This brings me to my third reason to set aside changes in working capital: the distinction between maintenance and growth capital. Ben Graham reminds us that a company’s earnings are only true profits if the expenditures necessary to maintain the company’s earnings power have been made; otherwise a company is merely liquidating itself in slow motion. I have always been skeptical of projecting a company’s growth rate; I attempt to find companies that would be attractively priced even if there is no growth at all, or even shrinkage. This conservatism leads me to assume that all fixed capital investments are required to maintain the current level of earnings power, not to produce growth in future periods.

However, the argument for this assumption is weaker in the case of working capital. Despite the theoretical nonrecurrence of changes in working capital, it would be unrealistic to expect a business with $500 million in sales to have the same level of working capital as it did when sales were $50 million. As a result, we would expect such a company to have made significant investments in working capital over the years, which would constitute a cash sink in the accounting periods leading up to it. This cannot be explained away as being potentially reversible in future periods; even if there is volatility in levels of working capital from the beginning to the end of this process, there is still an inevitable upward drift.

However, as we are told in Mulford & Comiskey’s Creative Cash Flow Reporting, a valuable resource that focuses on ferreting out a company’s sustainable cash flow from its earnings and cash flow statements, a company’s working capital is expected to rise and fall alongside the size of a company’s business. Therefore, ceteris paribus it will be increasing for growing companies, flat for stable companies, and declining for shrinking companies. In other words, investments in, and drawdowns of, working capital would be generally associated with increases and decreases in a firm’s level of activity. I.e. investment in working capital is growth capital.

This conclusion, which I think is the strongest defense of setting aside changes in working capital, also allows us to zero in on the key vulnerability of my approach. If there is an increase in working capital that is not associated with an increase in a business’s level of operations, but is instead due to lower margins, decreasing efficiency, and so forth, then ignoring changes in working capital can lead an investor into making fatal mistakes. However, I would say that more often than not this occurrence can be identified by examination of a company’s financial statements, in areas such as profit margins and movements in incremental sales versus incremental working capital although the latter should probably be smoothed over a number of years.

As a result, I can say that my approach towards setting side changes in working capital when calculating a business’s free cash flow, although nonstandard, does not generally introduce fatal inaccuracies in my estimates of future earnings power. Provided that a company does not invest in additional working capital inefficiently, investments in working capital would generally fall under the category of nonrecurring, or growth capital, both of which would fall out of our estimation of theoretical long term earnings power. And having performed this investigation in my investment methods, I have found a significant investment metric, incremental sales versus incremental working capital, to examine in greater details in future valuations when changes in working capital have been significant.

0

Best Buy (BBY) – Too cheap to ignore

June 15, 2011
Tags: ,

They do say that value opportunities are usually found in small, out of the way places. I have found this to be true, but sometimes even large companies we’ve all heard of can hold significant value. Best Buy has a free cash flow yield of roughly 15.8% as of this writing, once its excess cash and investments are taken into account, and free cash flow has been remarkably stable over the last few years. The company is looking to streamline operations and push out its Best Buy Mobile stores, which do only mobile products and services and which are based on a model that seems to be producing positive results in the UK. Hopefully this will offset any loss in revenue from the traditional entertainment and consumer electronics sections.

For my full opinion on Best Buy, please visit

http://seekingalpha.com/article/274950-best-buy-great-cash-flow-solid-earnings-inexplicably-low-valuation

0

AMCON (DIT) – An attractive convenience store supplier

June 8, 2011

AMCON Distributing Co. is a wholesale distributor of consumer products, which constitutes the bulk of its business, and also runs fourteen health food stores. The wholesale segment is the 9th largest in the country and provides mainly tobacco products, but also candy, beverages, paper products, health & beauty, frozen foods, and institutional food services. It has five distribution centers in Illinois, Missouri, Nebraska, and both Dakotas and serves mainly convenience stores.

Cigarettes represent roughly 72% of AMCON’s wholesale revenues. In its financial reports the firm claims to have efficient operations and economies of scale, but I’m not sure I see a moat. The current free cash flow yield to common shareholders as normally calculated is an amazing 20.5%, although there is a convertible preferred issue with a conversion price that is well below the current price, and the resulting dilution must be taken into account. Even so, I calculate that AMCON is trading at a large discount to its fair value. Furthermore, operating trends at AMCON are positive, although I would not care to project these current trends as a guide to the future. Sales have increased 11.5% for full year 2010 as compared to 2009, and although gross margins slipped, free cash flow margins remained flat owing to lower interest expenses. Furthermore, inventory turns increased and the cash conversion cycle shortened.

Turning to the figures, in 2010 sales were $1011 million, reported operating income was $15.5 million, capital expenditures in excess of depreciation were $.5 million, producing operating cash flow of $15 million. Interest expense was $1.5 million, leaving pre-tax income of $13.5 million and after-tax income of $8.9 million. Deducting $.3 million in preferred dividends leaves free cash flow to common shareholders of $8.6

2010 2009 2008
Sales 1011 907 860
Operating income 15.5 15.4 11.7
Excess capital spending .5 .5 -.5
Operating cash flow 15 14.9 12.2
Interest expense 1.5 1.6 2.9
Pretax earnings 13.5 13.4 9.3
After-tax earnings 8.9 8.5 6.2
After-tax free cash flow to common 8.6 8.2 5.9

Furthermore, inventory turns improved and the cash conversion cycle shortened, based on balance sheet figures at the end of fiscal years 2008 and 2009. In 2009 there were 24.3 inventory turns, and in 2010 there were 29.3. The cash conversion cycle in 2010 was 17.8 days, while in 2009 it was 20.7 days, although inventory levels at the close of 2008 did appear somewhat high.

2011 is shaping up well as well. Sales were $462 million as compared to $474 million for the first two quarters last year. However, margins were slightly improved, although perhaps not by a significant amount. Operating income was $6.3 million versus $6.2 last year; excess capital expenditures were $.1 million as compared to $.4 last year, so operating cash flow rounds to $6.3 million versus $5.8 million last year. Interest expense was $.6 million versus $.8 million last year, leaving $5.6 million in pretax income, versus $5.1 million last year. After estimated taxes, we have $3.5 million now, and $3.1 million same time last year. After preferred stock accruals, we are at $3.3 million in free cash flow to common, versus $3 million for the same period last year, which is encouraging.

AMCON has also been chipping away at its debt at a fast rate, having reduced debt from $38 million at the end of 2008 to $20 million as of the latest 10-q. However, debt levels are presently higher owing to the recent acquisition of the distribution assets of LP Shanks for $16.4 million.

In terms of the convertible preferred shares I mentioned earlier, there are two issues of preferred shares, the first consisting of 82481 shares that convert at $30.31, for a total of $2.5 million, and 81135 more that convert at $24.65, for a total of $2 million. Both issues have a dividend payout of between 6 and 7 percent. As the company now trades at $71.40, and still appears cheap based on an earnings multiple of roughly 5x, the conversion premium must be taken into account.

If we apply a multiple of 10x, which I think is a reasonable multiple for this company, we would have a market cap of $86 million. If we neglect the preferred stocks, $86 million divided among 590 thousand outstanding shares would produce a price of $147. However, if the shares are converted, the total shares outstanding increases to roughly 770 thousand, and the price target goes to $115. Despite the high conversion value, the preferreds are still redeemable at a small premium over face value at the option of the Company. However, the two series of preferred shares are respectively owned by Chris Atayan, the CEO, and an unidentified financial institution that placed Mr. Atayan on the Board of Directors, so it is not likely that outside shareholders will benefit from the redemption privilege.

I have to reserve my final thought for liquidity. The daily volume of this stock is roughly 1500 shares. Many days there are only one or two trades, and there are days where the company does not trade at all. This is not uncommon for micro-cap stocks, but I have taken the position, in discussing other microcaps, that liquidity is not as important to the long-term investor, because as Ben Graham noted in Security Analysis, such an investor should rarely have to sell in a hurry. Besides, the events of 2008 have shown that liquidity is often an illusion anyway. Damodaran, in his useful toolkit Damodaran on Valuation, does make it clear that there is a yield premium for illiquidity observed in the market. But, as value investors, who have the patience to wait for our prices, we can follow the advice of Ben Graham and not worry about the liquidity that we have little need for, and thus collect a premium that has no effect on our activities and costs us nothing.

Therefore, I can say that Amcon is trading at a significant discount to reasonable valuation, even taking the convertible preferred stock into account. A such, I can recommend it as a portfolio candidate for investors who can tolerate illiquidity.

1

In Defense of Goldman Sachs (Yes, Really)

June 5, 2011

It may be Stockholm syndrome, but I do think some of the criticism of Goldman Sachs regarding its subprime deals is overblown. I don’t deny that there have been apparent violations of the securities laws in terms of disclosures, but the central issue that upset Senator Levin and Matt Taibbi so much has not seemed to be the disclosure violations, which have the air of “technicalities” about them. Their major criticism seems to be that Goldman Sachs was selling synthetic mortgage CDOs despite the fact that the firm was perfectly aware that the securities would inevitably blow up. However, I think this is the least troubling aspect of Goldman Sachs’s subprime dealings, and not even worth making a rule against.

Senator Levin’s constant refrain in the Congressional hearings on Goldman Sachs’s last year was that Goldman Sachs was selling securities that it was secretly betting against. Specifically, he charged that the bank issued synthetic CDOs to clients without disclosing that Goldman Sachs was retaining a short position on the subprime mortgage market because it believed the securities to be a time bomb that it wanted off its books as soon as possible.

I do not find this a disturbing revelation in any way. As a value investor, and really, as any kind of investor, I consider it the fundamental prerogative of any market participants to make the bets they believe will produce a profit. Nor do I consider it necessary, or even productive, for market participants to have to disclose their investment thesis to the counterparties. The basic model of financial markets is (more or less) willing buyers and willing sellers coming together and trading at a price they have agreed on. This freedom to take positions is central to the functioning of financial markets (and that is why I found it so troubling that former SEC chairman Cox decided to outlaw short selling in financial stocks during the subprime crisis).

Here, Goldman Sachs is being criticized for having a view on the subprime market, which happened to be a correct one, and for keeping that view to itself in constructing these subprime deals. However, Goldman Sachs’s view was only that: a view, an opinion. The people who bought these deals had access to the same information that Goldman Sachs did, and reached the opposite conclusion, or at least concluded that the interest received in the deal compensated them for the risk. The key point, in my view, is that a participant’s opinion alone does not affect the future performance of the deal, and therefore there is no need to disclose it. After all, I don’t disclose my investment thesis to the people I buy stock from (and in fact I couldn’t because the impersonal nature of brokerages and exchanges means that I don’t even know who they are).

However, buying and selling stocks on the secondary market is perhaps not the same as being a bank that sponsors a synthetic CDO. The latter is required to disclose the material facts relating to the issue. The question, then, is whether Goldman Sachs’s opinion of the subprime market, which it has chosen to express by wanting to be short, is a material fact. The question of what is a material fact is specific to the circumstances. The general formulation is that a material fact is any fact where there is a substantial likelihood that the fact, if disclosed, would assume actual significance in the purchaser’s decision to buy or not.

As I stated above, the mere market view of Goldman Sachs is an opinion, not a fact. This opinion alone cannot affect the future performance of the deal, or allow the firm to reap profits from the purchaser in a manner that has not been previously disclosed. As a result, even if the existence of Goldman Sachs’s opinion is considered a fact, it would not qualify as a material one.

But Goldman Sachs did more than develop an opinion and keep quiet about it. Goldman Sachs sought to express that opinion with a short. The Hudson and Timberwolf deals seem to be, in essence, an attempt by Goldman Sachs to clear the credit risk of its long positions in subprime mortgages by transferring the risk to whoever would be persuaded to take it on. Now, of course Goldman Sachs could offloaded the risks with credit default swaps without creating a synthetic CDO, as the market at the time was not completely frozen. But the successful issuance of a synthetic CDO has the same risk transference effect but also allows for management fees.

A synthetic CDO is made of a basket of credit default swaps whereby the buyers of the deal receive a fixed payment in exchange for guaranteeing the underlying securities against default. In the event of default, they are required to pay the difference between the defaulted value and the face value. Obviously, as with all derivatives, a credit default swap requires a counterparty to take the other side of the deal.

In other words, any parties to a derivative knows that somewhere out there on Wall Street there is someone who stands to make all the money that they will lose, and vice versa. And, in fact, in the case of the infamous Hudson and Timberwolf deals, the buyers knew who that party was: it was Goldman Sachs. The standard structure of a credit default swap, according to the standard fixed income reference guide, the very useful Handbook of Fixed Income Securities, is that the bank that sponsors the deal is the protection buyer, and this arrangement was disclosed in the Hudson and Timberwolf offering documents. Thus, the purchasers of these deals knew that Goldman Sachs was short. As for the reasons that Goldman Sachs wanted to be short, or if it had seen the need to take any steps to offset the short position, that brings us back into opinion-land.

I do not mean to suggest that Goldman Sachs was completely blameless in these deals; it described the Hudson deal as not a balance sheet transaction when it was a textbook balance sheet transaction, an attempt to transfer credit risk assets that Goldman held. It also described the Hudson assets as being sourced “from the Street,” which the company lamely defended by pointing out that Goldman Sachs was part of the Street. And of course there was the Abacus deal, where the plan’s asset manager was described as independent when in fact he was being advised by John Paulson.

What depresses me about the whole synthetic CDO business is not so much that Goldman Sachs has such cynical but talented salesmen, but that the buyers of these complicated instruments seem to have learned nothing . I may be lacking in sympathy for the buyers of these deals because any student of recent history could have seen this game being played over and over. In Frank Partnoy’s book Fiasco: The Inside Story of a Wall Street Trader, which details the author’s experiences in structured finance at Morgan Stanley and which should be required reading for anyone who still has any lingering trust of Wall Street, he describes the same situation, the gaming of the ratings agencies’ ratings, the buyers who were less sophisticated than their sellers and were either unwilling or unable to make an independent assessment of the offering documents and who were willing to assume, for example, that particular AAA structured note paid a yield spread over a vanilla security of a similar credit rating because the issuers and underwriters were incompetent, not because the issue had an embedded short option position on the Mexican peso.

Of course, when I say people have learned nothing, I don’t mean literally nothing. The people who have now acquired firsthand knowledge of the dangers of leverage and shorting volatility are the ones who have been escorted from Wall Street in disgrace (imagine being the one who recommended buying the Abacus deal in a job interview). I recall reading somewhere that the majority of people working on Wall Street now were not even present during the dot-com collapse. Perhaps Nassim Taleb is right; the best qualification in this world is grey hair.

At any rate, the enduring rule that has come from subprime mortgage securities debacle (and the structured finance debacle, and the junk bond debacle, and the Latin American debt debacle) is caveat emptor. (And the second rule, obviously, is not to play with borrowed money). It seems to me that all the disclosure laws and ratings agency opinions in the world cannot serve to erase the necessity of adopting a skeptical, defensive attitude towards any financial products and the people who sell them. If market participants would remember that, we would have no reason to excoriate Goldman Sachs for doing what we all wish we had the sense to do.

1

River Rock Entertainment Authority: The final obstacle to refinancing now resolved

May 31, 2011

Those of you who have been following my articles on the River Rock casino bonds will recall that they fall due for refinancing in November of this year, and that this refinancing process has been delayed because the casino is negotiating its agreement with Sonoma County. If you haven’t been following my articles, that should pretty much bring you up to date.

The agreement with Sonoma County required River Rock to build an emergency access road, and also to pay to the county $75 million by 2020 in order to address the increased usage of county resources caused by a planned expansion of the casino. Now that the expansion has been put on indefinite hold, it would seem that the county requiring the full $75 million would place an undue burden on River Rock’s finances and also be unfair.

The River Rock Entertainment Authority has renegotiated the agreement, cutting the required payments from $5 million per year, increasing by four percent annually, to a flat $3.5 million per year. However,  if the expansion does open River Rock will have to make such additional payments as to bring the total payment (including the $10.3 million already paid) to $75 million, and at any rate the full $75 million must be paid by 2020, subject to future negotiation. Furthermore, the Authority also secured an agreement to build the road on an alternate site, which is now in escrow, and which allows for a 20% grade instead of a 10% grade, a change which the casino estimates will save up to $15 million.

So, now that the $75 million obligation has been deferred, which reduces its present value, and the road savings plan is looking more definite, it would appear that River Rock is a more attractive prospect from the perspective of a bond buyer. Based on last year’s free cash flow figures, and treating the $3.5 million annual payment as a fixed charge, the casino has a fixed charge coverage ratio of 2.5x, as compared to 2.3x before the renegotiation, which is a more attractive situation. Also, the River Rock Entertainment Authority has $43 million in cash on its balance sheet, which, if the new road plan goes through, would be more available as a source of liquidity or simply to pay back part of the bonds. As result, it should be easier for River Rock to refinance.

The market seems to greet this renegotiation with approval; prices have improved to around 92 from generally 88 before the announcement (as a reminder, the bonds were at 84 when I recommended them). River Rock now has a clear route to refinancing (and not too soon, I should note, as refinancing bonds seems to be a months-long process). I still find this issue attractive and find it highly unlikely that there should be no refinancing.

110

Cal-Maine (CALM): Even eggs can be exciting

May 23, 2011
Tags: ,

Cal-Maine Foods (CALM) is one of the largest egg producers in the United States, with a market cap of roughly $675 million. Of this, $213 million is represented by excess cash and short term investments, and the free cash flow yield on the balance is roughly 16%, or 15% when considering average profit margins over the last five years.  Although egg prices are highly sensitive to supply, Cal-Maine has been expanding specialty eggs as a portion of gross sales. Specialty are organic, cage-free, etc., and more importantly are both less sensitive to supply and offer higher profit margins.

Please my full opinion on Cal-Maine at

http://seekingalpha.com/article/271363-cal-maine-foods-profit-opportunity-in-the-egg-business

0

Servotronics (SVT) – An attractive microcap

May 11, 2011

I was sick last week, but I have returned and I brought a promising microcap company called Servotronics (SVT) with me.

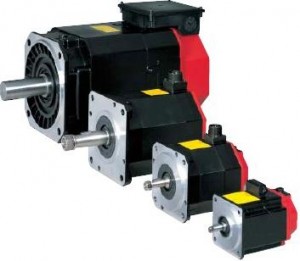
Servotronics is a small company; daily volume averages only about 1200 shares, but it offers excellent figures. It operates in two sectors, one of which is, obviously, making servos such as torque motors, electromagnetic actuators, and valves for use in the aerospace and missile industries. 21% of Servotronics’s servo sales in 2010 were made, directly or indirectly, to the US government. Servotronics’s other sector is the cutlery business, from cooking knives to utility knives to machetes and bayonets. 21% of Servotronic’s 2010 sales of cutlery were also to the US government, although this is down from 28% in 2009.

The balance sheet of Servotronics is attractive; almost in a net-net situation. The company has a market cap of $18.8 million and has $4.4 million in cash, $5.4 million in receivables, and $11 million in inventory, total $21 million, set against $7.2 million in total liabilities. At any rate, because noncash current assets cover current liabilities (in fact, they cover total liabilities), the cash on the balance sheet can be considered excess.

In terms of earnings, in 2010 sales were $32 million, reported operating income was $3.1 million, excess depreciation was $160 thousand, producing operating cash flow of $3.3 million. After interest expense of $74 thousand, and taxes of 35%, we have free cash flow to equity of $2.1 million. Based on the current market cap this is a free cash flow yield of 11.1% before excess cash is taken into account, or 14.6% when the excess cash is taken into account. The company has very low interest rates because the bulk of its long-term debt, $3.1 million, consists of Industrial Development Revenue Bonds issued through a government agency and carrying an interest rate of .54%. Given Servotronics’s sensibly modest use of debt, I do not anticipate the situation will worsen when the bonds fall due in 2014.

In 2009, sales were $33 million, reported operating income was $2.6 million, excess depreciation was $118 thousand, producing operating cash flow of $2.7 million. After interest expense of $84 thousand and taxes, the company produced $1.7 million in free cash flow.

In 2008, sales were $34 million, reported operating income was $4.7 million, excess depreciation was $42 thousand, producing operating cash flow of $4.8 million. Interest expense was $178 thousand, and after taxes we have a free cash flow of $3 million.

In 2007, sales were $31 million, reported operating income was $3.5 million, excess depreciation was $66 thousand, producing operating cash flow of $3.6 million. After interest expense of $255 thousand, and taxes, we have free cash flow of $2.1 million.

As we see, then, the earnings history of Servotronics is reasonably stable, which gives us confidence that the free cash flow figures are a reliable indicator of a company’s future earnings power. Servotronics also pays a modest annual dividend of 1.6%.

I do need to address, however, the liquidity aspect. Obviously, it would be unwise to use market orders instead of limit orders, but even so, market participants place an importance on liquidity and may insist on a higher return from microcaps like this one. Damodaran, in his useful Damodaran on Valuation, estimates that this premium could reach 30% or more, although many of his examples are drawn from private equity firms, where the market is nonexistent, rather than the stock market where the market is simply thin.

As for this matter, I would first remind us all that liquidity is often an illusion, as we discovered with auction rate securities in 2008, and furthermore, I am reminded of what Ben Graham said about liquidity in his Security Analysis, that it is the sine qua non of speculators, while investors, who if they follow sensible financial policies will hardly ever be forced by circumstances or margin calls into liquidating in a hurry, should find liquidity of secondary concern to value. Even so, the bid-ask spread for Servotronics, from what I’ve observed, can be 1-3% of the share price, which can be a difficult hit even when spread over a long holding period.

At any rate, I find Servotronics to produce stable earnings that are ample relative to the company’s price, and with a little caution and trading skill, one could easily build a position that can produce satisfactory returns.

4

Revlon (REV): High debt, but positive developments

April 29, 2011
Tags: ,

I recently examined Revlon (REV), a makeup company which has had a spotty and debt-laden history but which has turned the situation around in the last four years, assisted by substantial overseas growth. Although the firm is still dealing with the debt that Ron Perelman saddled it with during its LBO, it offers a free cash flow yield of more than 10% when its tax loss carryforwards are taken into account, and Ron Perelman seems to stand ready to serve as an (expensive) lender of last resort.

For my full views on Revlon, please visit

http://seekingalpha.com/article/266582-revlon-positive-operating-trends-and-a-low-valuation

0

Smart Modular (SMOD) to go private – You’re welcome

April 27, 2011

It was announced yesterday that Smart Modular Technologies (SMOD) would be taken over by a private equity firm for $645 million, or $9.25 per share. When I recommended it here on January 3, the price was $5.94. Not bad for a few months’ wait, I think.

1