Make Yourself Immune to Interest Rates

April 7, 2014

I am one of the no doubt very few people in the world who enjoy watching the Federal Reserve Chair testifying before Congress. Among the issues presented in the latest round from Chair Yellen was the difficulty of old people coping with the low interest rate environment in living off their investment income. The Chair, while acknowledging these concerns, could naturally offer no comprehensive solution, partly because her mandates cover unemployment and price stability, not increasing the supply of old-people-appropriate investments, and partly because it’s not her job to offer portfolio management advice anyway.

220px-Janet_Yellen_official_portraitThe source of this criticism frequently seems to be the conservative side of Congress, which has often been suspicious by nature of the Federal Reserve and which has been stymied in its efforts to undermine the institution’s policies by the U.S. economy’s stubborn refusal to collapse into hyperinflation. Having lost, for the moment at least, the argument that the Fed is incapable of managing both inflation and unemployment, thus justifying the removal of one of these mandates, the conservative argument seems to be making up a new mandate, high yields on safe investments, apparently acting on the theory that if the Fed cannot handle two mandates it certainly needs three of them.

Politics aside, though, it does seem unsatisfactory that old savers, or at least their desire to live off of interest income, should be collateral damage of the Fed’s policies, and the solution of taking on more risk is unpalatable even if the portfolio size and life expectancies of some retirees could justify it. And although value investing is effective for bonds as well as stocks–much of Ben Graham’s Security Analysis deals with bonds and many famous value investors have made a reputation and a fortune in fixed income–there is no readily apparent solution to low interest rates, particularly if the broader market is also reaching for yield, based on observed low and declining spreads between Treasury and high yield bonds. Not much can be done about low interest rates now.

But there is something that could have been done before now. As we all know, bond prices and yields move in opposite directions, a principle so well-known to fixed income investors that I don’t even need to cite it (oh, all right, The Handbook of Fixed Income Securities, Eighth Edition). Furthermore, we have ways of modeling exactly how far prices will move in response to a given change in yields, so that with the right choice of bonds we can insulate our future income against the actions of the Fed, or even in a pre-quantitative-easing world, of people other than the Fed as well.

The method is as follows. The value a bondholder derives from a bond comes from three factors. These are the market price, the interest the bond pays, and the proceeds of reinvesting the interest payments. If interest rates increase, it stands to reason that the market price will decline but the reinvestment income will increase, thus offsetting the decline in the market price. Likewise, if interest rates decrease, the price of the bond will rise but the reinvestment income will fall. But the question that concerns us is when the change in the market price and the change in reinvestment income will cancel each other, thus leaving us in the same position we were if interest rates had not changed at all. This method is called bond immunization.

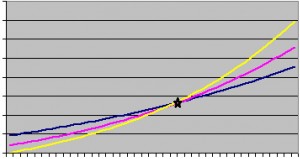
immunization2And it turns out that not only do those changes offset each other, but in theory they do so in quite an elegant manner. For a single bond, and for a single parallel shift in the yield curve (i.e. all relevant interest rates move by the same absolute amount), then the changes to market price and reinvestment income will exactly offset each other at a single point, regardless of which direction or how large the interest rate move is. That point is the duration of the bond. The duration, by the way, is the weighted average of a bond’s cash flows multiplied by the time until they are received, and also measures by what percentage a bond’s price will change in response to a change in interest rates. *

The point of this discovery is that if we are capable of predicting our future retirement expenses for a given year, we simply purchase bonds with a future value equal to those expenses and with the same duration as the year in question. This can be done for multiple years as long as durations are available, and at that point we arrive in the blurry and indistinct future that would be best met with equities. At any rate, the lower interest rates become, the longer bond durations become, so this method is even more usable in the current environment. This immunization technique is commonly used among those mythical creatures known as defined-benefit pension funds, and there is no reason the same logic does not apply to individual investors.

Well, when I say “no reason,” I am neglecting taxes. Also, interest rates have an irritating tendency to move in nonparallel shifts, which is to say that short-term and long-term interest rates sometimes shift by different amounts. But the biggest pain is that bond durations tend to drift over time, rather than decline perfectly in line with the approach of the year they were keyed to. The consequence of these factors is that a bond portfolio cannot be immunized and then ignored; it has to be rebalanced. However, all portfolios need to be rebalanced, so I don’t think this is a valid objection. The fact that there is a tradeoff between predictability of outcomes and not incurring transaction costs is known to anyone who has anything to do with hedging, see Nassim Taleb’s Dynamic Hedging: Managing Vanilla and Exotic Options.

It may be objected that this strategy is not strictly living off of one’s income, since half the time our bond prices will instantly go up and no matter what happens making these moves years in advance of the year in which we need the money means fiddling with our account balances anyway. But the goal in retirement investing shouldn’t be never to touch the principal; it should be to never outlive it. If we have more principal than otherwise through adopting this immunization strategy, and we have to draw it down in the target year, that is the strategy working as intended. And, really, if we never intend to touch our principal what is the point of having it?

In general terms, those who refuse on principle to invade their principal, and the conservative Congressmen at Chair Yellen’s hearing, are missing the point. They are analyzing assets in a vacuum, rather than taking into account the liabilities those assets are intended to meet. This is at best a suboptimal method and at worst one that leads to inadequate income, since interest rates are what they are and unless we happen to be Chair Yellen, we have no control over them but can only position ourselves in advance to respond to changes in them. And, since bond immunization works when interest rates rise as well as fall, the current concerns about the impact of the present tapering of quantitative easing suggests this strategy as much as the cutting interest rates and quantitative easing itself did.

It may further be objected that this strategy is complicated, requires a great deal of attention, and often requires a large portfolio to make the additional transaction costs worth the trouble. These objections are certainly valid, but bond immunization can be approximated, which would be better than nothing. And at any rate it is a little galling to me to see Congressmen and old people themselves up in arms because they are apparently unaware that such a strategy exists.

* Image modified from one appearing at http://finance.ewu.edu/finc431/lecture/Chapter%2010.htm

0

NASB – Banking on a Return to Normalcy

February 5, 2014

Banks are sometimes difficult to get a handle on; the Citigroup 10-K for fiscal year 2007 was over 200 pages long and you could have read every word of it and not found a line reading “Oh, by the way, we’re doomed.” But not every bank is a too-big-to-fail megabank that dabbles in derivatives; the vast majority, by number if not by total assets, are regional banks that go about the ordinary, everyday business of taking in deposits, lending money, and selling those loans to a securitization entity (sorry, some things do change).

NASB Inc. is such a bank, and is worth looking at. It combined a conservative style with a high return on assets, and last year managed a negative provision for loan losses (which is a rare and impressive feat). Now that the taper is on and things are slowly returning to normal, it can reverse its deleveraging plan and get back to the good old days. And in 2007 they might not even have been doomed.

For my full thoughts on the matter, visit

http://seekingalpha.com/article/1991151-nasb-financial-banking-on-a-return-to-normalcy

0

Cott Corporation (COT) – I think not.

December 27, 2013

Like many investors, I’ve always liked used basic company statistics as a screen to identify companies worthy of more in-depth investigation. I readily admit that there are many qualitative aspects to a company that are unlikely to show up in the figures, but on the other hand, a corporation is a device that turns cash into (hopefully) more cash, and so qualitative aspects are important only to the extent that they can be expected to show up in the numbers eventually, and when it comes to stock purchases, a false positive (buying a stock that shouldn’t have been bought) strikes me as more painful than a false negative (not buying a stock that should have been bought), and at any rate, I don’t always have the patience to heed Warren Buffett’s advice to just “start with the A’s”.

However, a screener is only the first step. Although the goal of screening is to identify a company with a high free cash flow yield, the subsequent analysis and digging into the SEC filings and other useful sources is to determine whether the historical performance is likely to be repeated or whether the same is doubtful, because many companies have low multiples for a reason.
open blank soda can6636619Such a company, unfortunately, is Cott Corporation, which produces private-label sodas and other beverages. Although its free cash flow yield based on historical performance is a robust 10% when excess cash is taken into account, the company’s competitive position and the movement against sugared beverages cause me concern as to whether these cash flows will be likely to repeat themselves in future, and the performance during the current fiscal year seems to suggest that things are already beginning to unravel. I know it is a common weakness of analysts that we cannot see two points without drawing a line through them, nor three points without drawing a curve as well, but again, false positives…

Cott corporation’s produces soft drinks, juices and juice products, flavored waters, energy drinks, sports drinks, teas, and some alcoholic beverages as well. It operates in the private-label, or store-brand markets, and has operations in the United States, Canada, and the United Kingdom. The company is the largest private-label producer in the United States and the United Kingdom. Lately the firm been trying to diversify away from carbonated beverages, reducing them from 50.4% of total sales in 2010 to 39.1% in 2012, a goal that has been partially accomplished through acquisitions.

Naturally, much of Cott’s business is concentrated among the large grocery store chains that can sponsor a store brand, with over 10% of its sales coming from Wal-Mart alone. The company uses long-term supply contracts, but apparently its ability to pass increasing costs on to its customers, as the company also relies on futures contracts for aluminum, corn, and sugar, as well as forward contracts for plastics and other ingredients when available.

The company’s market cap as of this writing is $760 million, and based on its latest balance sheet there was $126 million in cash and its noncash current assets exceed its current liabilities, indicating that the cash can be treated as excess. Thus, the market value of Cott’s operating assets is $634 million.

On the free cash flow side, in 2012 sales were $2.251 billion, gross profit was $290 million for a gross margin of 12.9%. Operating income as reported was $110 million, depreciation was $101 million and capital expenditure $75 million, resulting in operating cash flow of $136 million. Interest expense was $56 million, leaving $80 million, which after estimated taxes of 15% (Cott is headquartered in Canada where corporate taxes are lower than in the United States), free cash flow was $68 million, and subtracting $4 million for noncontrolling interests gives free cash flow to shareholders of $64 million. This works out to a free cash flow yield of just above 10%.

In 2011, sales were $2.337 billion, and gross profit $277 million for a gross margin of $11.8%. Operating income as reported was $101 million, depreciation was $99 million and capital expenditures $55 million, plus $2 million in noncash impairments, producing operating cash flow of $147 million. Interest expense was $57 million, leaving $90 million, which is $77 million after estimated taxes. After subtracting noncontrolling interests of $4 million, we have free cash flow to shareholders of $73 million.

In 2010, sales were $1.803 billion, gross profit of $266 million and gross margin of 14.8%. Free cash flow to common shareholders was $64 million.

Cott claims that in 2012 it exited certain low-margin businesses, which lowered sales but expanded margins. It also explains the increased capital expenditure as being part of a vertical integration program. In 2010, Cott acquired a private-label juice company for $500 million, which explains the jump in sales between 2010 and 2011.

As I stated before, the cash flow situation at Cott seems to be unraveling somewhat already as 2013 goes on. During the first three quarters of 2013, sales were $1.612 billion versus $1.773 in 2012, gross profit $198 million versus $229 million and gross margins 12.3% versus 13.2%. Operating income was $74 million versus $93 million, and ultimately free cash flow to shareholders was $49 million versus $58 million. The fourth quarter is typically not a large contributor to earnings, as one expects during winter from a company that sells nice cold drinks.

Normally, I would warn against making too much of the results of a single quarter or year, as the information content of those results often does not explain the wild swings in prices that accompany their release. But what the results do make clear is that Cott Corporation’s margins are unstable, and this will be the case even if Cott does manage to reverse the current decline in earnings. These unstable margins are a telling symptom of Cott’s unenviable competitive position. More than half of its earnings come from only 10% of its customers, and 10% of its sales come from Wal-Mart alone, and anecdotally being a Wal-Mart supplier is said to be a highly frustrating experience. Furthermore, as stated above Cott has difficulty in transmitting changes in input costs to its customers, hence the push towards vertical integration in 2012.

Furthermore, although the company is looking to expand its range of offerings, the largest category of sales are still private-label sodas, which are currently under attack as the cause of obesity, even outside of New York City. Furthermore, sodas are a low-margin business anyway; in 2012, although they represented only 41% of Cott’s sales volume, they were 63% of its physical volume. And unfortunately for Cott, the market for private-label sodas is naturally constrained because of the presence of the leading brands, which are in a position to suck up a great deal of any rebound in the popularity of soda. As Ross Johnson, then-CEO of Nabisco and a fellow Canadian, said years ago in Barbarians at the Gate, he had to sell off Canada Dry because even if the company could walk on water, Pepsi and Coca-Cola are waiting on the other side.

For these reasons, despite the apparently attractive yields of Cott Corporation, I cannot recommend it as a candidate for portfolio inclusion.

0

Food Stamps and the Price of the Minimum Amount of Food in 1935 England and Today

October 15, 2013
Tags: ,

Catchy title, no?

Anyway, between the government shutdown and the debt crisis, I’ve found looking at investments rather dispiriting, as the ensuing chaos in the markets would override even the soundest of analysis. So, I’ve been keeping my head down by catching up on my reading at least until this all blows over.

One of the things that has been affected since even before the shutdown was the deep cuts to food stamps in a bill passed by the House, and of course with the shutdown and debt ceiling debates still unresolved, the existing federal food benefit programs are also hanging over the abyss.

dates-300x285But this put me in mind of George Orwell’s The Road to Wigan Pier, where the author visits a mining town in the north of England to comment on the dirt and poverty there, and also the nature of public assistance, which in the Depression-era 1935 was a non-trivial subject. One issue that concerned him was a “disgusting” public debate over how small an unemployed person’s food budget had to be without actually causing them to die of malnutrition. One dietitian put it at five shillings, ninepence, while a more generous one had five shillings, nine and a half pence. But it also led to some snooty letters to the editor about how four shillings should be more than sufficient, including a sample menu.

So, out of my own interest, I thought I would see how well this weekly food budget withstands the test of time, and how it compares with the food stamps allowance of today, using my local Safeway as a source.

George Orwell’s original list was

3 wholemeal loaves, 1 shilling
1/2 lb. margarine, 2 1/2 p
1/2 lb. dripping (beef fat), 3 p
1 lb. cheese, 7 p
1 lb. onions, 1 1/2 p
1 lb. carrots, 1 1/2 p
1 lb. broken biscuits, 4 p
2 lb. dates, 6 p
1 tin evaporated milk, 5 p
10 oranges, 5 p

As he says, if one were challenged to extract as much nutrition as possible from four shillings, this would be about it. He also points out that none of these ingredients require cooking (or refrigeration, although in the ’30s that was probably typical), and that trying to live on this regime for any length of time would practically drive one to suicide.

But if we modern people wanted to live on lard-and-raw-onion sandwiches (which were actually a thing, mentioned in The Jungle by Upton Sinclair as the lunch of an impoverished family of meat packers) and the occasional orange for dessert, the prices would be as follows:

3 loaves of bread $3-4.50,
1/2 lb. margarine: $1-1.16
1/2 lb. lard: $1.50
1 lb. cheese: $3-4
1 lb. onions $1.50
1 lb. carrots $1
1 lb. private-label vanilla wafers or animal crackers, $3.25
2 lb. bananas $1.50
1 box of evaporated milk $4.50 for 3 quarts’ worth.
5 lb. of oranges $8.

Total: $28.55-31.21.

I have made some substitutions, obviously. The range of prices in this list deals with whether one gets the club card discount. I have substituted lard for dripping because cow fat is not commonly sold retail. I’m not aware that one can specifically buy broken cookies, so I went with a close analogue. As for the bananas, dates may have been a staple in 1935 but in California they seem to be a luxury item at $8 a pound, while bananas are 69-79 cents a pound depending on the time of year.  Also, I don’t know how much evaporated milk is in a tin, and I suppose that some savings could probably be made in the orange department too, but too many substitutions would defeat the purpose of the comparison. I believe that most of the above foods, apart from the wafers/animal crackers, are not subject to sales tax.

According to the Internet, the average food stamp allowance in California is $149 a month, or $34.38 per average week. Looking up at the total, this food budget does allow for the above menu with an amazing $3-6 a week to spare, although in all fairness one should probably find a way to squeeze in a multivitamin ($9 for 100 pills).

The next question is how well this menu holds up against inflation, and there are two ways of doing it. The first way is to use the British inflation rate since 1935 and then converting it into dollars, and the second way is to convert into dollars in 1935 and to use the American inflation rates. Under the first method, 4 shillings in 1935 are worth 12.04 pounds today, which works out to $19.26. Under the second method, 4 shillings in 1935 were worth almost exactly a dollar, and a dollar in 1935 is worth $17.07 today. In both cases, the inflation-adjusted amount is below the present cost of the food.

I have to say that this result surprises me; I would have expected that advances in food production technology and the Green Revolution in fertilizers would have lowered the overall cost of food, but then again it is commonly criticized that more and more of the cost of food nowadays is the cost of transporting it to the market (especially true of bananas). Still, we in the modern era have the means to grow more food, store it for longer periods without spoiling, and have in the United States a superabundance of food, and yet we are less generous than the British were in the ’30s.

But what concerns me as well is that this menu was proposed not by a dietitian, but by a letter to the editor, which Orwell points out, may not have been genuine because no one could live on such a diet for a significant length of time without going insane. The actual dietitian’s minimum was nearly 50% higher than this weekly expenditure. And yet, based on the current food stamp allowance, which, recall, is itself in imminent danger of being cut off, the proposed menu barely fits at all. In a nation that exports literally millions of tons of food, I am surprised to hear that supplies of food to those on public assistance are lower than they were in the depths of a Depression despite 80 years of progress.

0

Skywest – Buy It For Its Cash Holdings, Keep It For Its Airline Business

September 19, 2013

Skywest (SKYW), a provider of regional flight services mainly to United Continental and Delta Airlines , has a balance sheet that I would describe as very interesting. The company literally has enough cash and securities on hand to buy back more than 80% of its shares. Skywest has a market cap of $793 million as of this writing, and its latest balance sheet shows $646 million in cash and marketable securities, which at first approximation implies that one could buy the company for its securities portfolio and get its entire future earnings stream for $150 million, which is less than the company earned in its last full year. In other words, removing Skywest’s excess cash and securities from the equation and valuing only the operating assets of the company gives us a P/E ratio of approximately one.

Unfortunately, that’s not quite how it works. Equity holders are at the end of a long list of prior claimants on a company’s assets, and Skywest has a significant amount of bank debt and also leases many of its planes. Therefore, the question becomes how likely it is that these liabilities will be met by Skywest’s future cash flows, so that the shareholders’ residual claim on the cash and securities is unlikely to be preempted.

As stated in Value Investing: From Graham to Buffett and Beyond, there are three sources of value for a company that roughly correspond to the past, the present, and the future. The balance sheet, where all of Skywest’s cash and securities exist, represents the past. The company’s earnings power as represented by its income statement is the present, and the company’s future growth prospects represents the future. The purpose of making this distinction is the varying degrees of reliability that the three sources have. The balance sheet is, barring accounting irregularities, reliable, although some figures need adjusting to reflect the realities of business. The recent income statements represent the present in that, although they require some insight as to whether the company can repeat the performance, the company has nonetheless established its present ability to produce these earnings and can to a degree be counted on to continue to produce them. The growth factor, representing the future, is the least reliable, first of all because the anticipated growth may not materialize, and second because, even if the growth does materialize, it is possible that the cost of the capital required to create the growth will equal or exceed the growth itself. The lesson, then, is to confine our investments to where the value proposition has the greatest reliability, ideally on the strength of the balance sheet alone. However, as those opportunities are rare nowadays, we should rely on the balance sheet and the current earnings power.

Turning back to Skywest, I believe that the levels of cash on the balance sheet are mostly safe over the long term. Skywest is cash flow positive from an operational standpoint, and although it has significant debt repayment obligations in future years, I find it plausible that the company will be able to roll over its debts. Furthermore, Skywest derives over 90% of its revenue from fixed-rate contracts, whereby its contracting partners, which are major airlines like United and Delta, pay the company a flat rate per flight-hour, modified by incentive bonuses or penalties. Furthermore, its partners reimburse Skywest for the cost of fuel and other expenses. This insulates Skywest from the two largest sources in earnings volatility that affect airlines: ticket prices and volumes and fuel prices. As a result, margins for Skywest can be expected to be more stable than those of most airlines, thus lowering the risk of substantial negative operating cash flows for a long period.

delta-pckSkywest runs approximately 4000 flights per day for short-haul flights between smaller regional airports and the major hubs, in airplanes that typically have a seating capacity of 70 or less. The terms of their contracts allow Skywest to use the airline codes and plane decals of its contracting partners. Skywest’s partners also handle the booking and, as stated above, reimburse Skywest for fuel and some other expenses, sometimes including wear and tear on planes. Nearly 2/3 of Skywest’s flights arise from a contract with United, and nearly 1/3 with Delta, with the balance made up by US Airways, American, and Alaska. Skywest’s contracts with these airlines typically run for five or more years.

Turning now to the figures, sales in 2012 were $3.534 billion, and reported operating earnings was $166 million. Depreciation and amortization were $252 million and net capital expenditures were $58 million, producing operating cash flows of $360 million. Net interest expense was $69 million, leaving $291 million in pre-tax cash flow, or $257 million after estimated income taxes at a 35% rate.

In 2011 sales were $3.655 billion, operating cash flow was $116 million, and estimated after-tax cash flow was $53 million. In 2010 sales were $2.765 billion, operating cash flow was $270 million, and estimated after-tax cash flow was $149 million.
After-tax free cash flow assumes a 35% income tax rate and that excess depreciation is not taxable. It is also calculated before net debt repayments.

The first half of 2013 is shaping up well. Operating earnings are comparable to those of the first half of 2012, although capital expenditures have increased to be more in line with historical levels. However, I should add that Skywest has recently been expanding its capacity, disposing of some of the smaller and more marginally profitable aircraft in its fleet and taking on larger ones, and also increasing its total number of flight hours by 3-6% on a year-over-year basis, so at least some of the additional capital expenditures for 2013 as compared to 2012 may be considered growth capital, i.e. expenditures intended to increase earnings power rather than simply to maintain it.

Thus far, sales in 2013 were $1.643 billion versus $1.858 billion for 2012, capital expenditures were $85 million versus $40 million, operating cash flows were $103 million versus $155 million, and estimated after-tax free cash flow was $58 million as compared to $109 million. Again, after-tax free cash flow assumes a 35% income tax rate and that excess depreciation is not taxable. It is also calculated before net debt repayments.

I should also point out that Skywest’s accounting policy is to record its fuel reimbursements as revenue, so although operating earnings are unaffected, this policy has an affect on the comparability of sales over differing periods.

I alluded earlier to the fact that Skywest leases many of its airplanes. Rental payments for Skywest come to roughly $330 million per year. Furthermore, the terms of Skywest’s loans requires them to make principal repayments of roughly $180 million per year for the next four or five years. However, maintaining this debt payment schedule would reduce Skywest’s level of long-term debt to barely a fifth of its historical level, and as debt repayments tend to produce a corresponding increase in borrowing capacity it should be entirely possible for Skywest to roll over its debts at least in part. Also, based on my research, Skywest’s level of total fixed charge coverage is comparable to those of its competitors, most of which do not enjoy the stability of margins that Skywest gains from its fixed-fee contracts.

Furthermore, although most airline companies maintain a large holding of cash and securities in order to maintain a cushion against the cyclicality of the airline industry, Skywest is unique among airlines in that its portfolio represents such a large percentage (over 80%) of its current market cap, and this despite its fixed-fee contracts providing significant insulation from the effects of cyclicality as well.

So, if Skywest’s performance remains on its current course, the company’s cash flow generation should be sufficient to leave its portfolio of cash and securities at its current level, while any future expansion of the company is also the shareholders’ to enjoy. At the same time, the portfolio should provide substantial protection from any downside moves as so much of the company’s value comes from financial assets already in place rather than uncertain future cash flows. Therefore, I can strongly recommend Skywest as a candidate for portfolio inclusion.

0

ACCO Brands – An attractive investment once adjustments are made

July 14, 2013

Whenever I’m in a store it always strikes me that every product on sale there, even the small and unusual ones, are produced by some fairly large and serious corporations that employ thousands of people and do millions in business.

office-supplies1One such company is ACCO Brands Corp., which makes office supplies, laminators, shredders, and notebooks and day planners. The company owns the Swingline brand and, following a merger last year, Mead as well. Half the company’s sales are outside the United States, and its largest customer is Staples at 13% of total sales. The company offers a prospective free cash flow yield of 11.8%, which is very attractive.

The Mead acquisition has created a great deal of complication in Acco’s financial statements, and in order to understand them a great deal of nonrecurring matters. The acquisition required a bridging loan, various restructuring expenses and investment banking fees, and a writeoff of capitalized debt issuance costs (As an aside, has any company ever had someone offer to buy its debt issuance costs? Then why capitalize them?). On the other hand, the Mead acquisition also allowed the company to reverse the prior writeoff of net operating losses. The strategic use of mergers to make use of tax loss carryforwards is a simple but highly effective corporate strategy, but it also gave Acco a negative income tax rate in 2012. As a result, to get at Acco’s long term earnings power it is necessary to ferret out both these nonrecurring expenses and this income tax bonus.

In 2012, sales were $1786 million and gross profits as reported were $533 million. Operating income as reported was $139 million. However, merger-related expenses were $23 million and Acco also took $24 million in restructuring. Furthermore, depreciation and amortization totaled $42 million, while the company made $30 million in capital expenditures. As a result, operating cash flow, apart from changes in working capital, came to $198 million. Reported interest expense was $89 million, but this includes $16.4 million in merger financing and $3.6 million in accelerated amortization of debt issuance costs, so long-term interest expense was closer to $69 million. (Actually, the company’s refinancing lowered its average interest rate and the company paid down $200 million in debt over the course of 2012, so the company’s future interest rate is likely to be even lower). This leaves $129 million in pre-tax cash flow to shareholders, which, applying a 35% tax rate, comes to $84 million. The company also had $7 million in earnings from a joint venture, bringing its long-term estimated earnings power to $91 million. Based on the current market cap of $773 million, this is a free cash flow yield of 11.8%.

In 2011 sales were $1318 million, operating income was $115 million and operating cash flow $128 million. Interest expense was $77 million, leaving $51 million in pretax cash flow, or $33 million after taxes, plus $9 million in earnings from the joint venture.

The company reports that its increased sales and gross profits in 2012 were entirely the result of the merger, and apart from this both sales and gross profits declined, owing to weaknesses in Europe and an ongoing shift away from paper day planning products in favor of electronic calendar applications and so forth. Acco is not above whittling away its less profitable lines of business, having sold off an Australian manufactuer of binding products in 2011 and making some smaller asset sales on an ongoing basis. As a result, we can expect further restructuring expenses–the company expects $25 million in restructuring charges in 2013, of which $10 have already occurred–and so it may be optimistic to treat restructuring expenses as nonrecurring, but to the extent they are associated with discontinued operations or severance, it is not per se inappropriate to do so.

For the first quarter of 2013, Acco reported a net loss, although taking restructuring and amortization of intangibles into account the loss was negligible. The company’s operations are seasonal, with the bulk of profits arriving in the second and third quarters, so this outcome is not a great concern. During the first quarter 2013 conference call, the company announced that it was anticipating $150 million in free cash flow for the year, which would be a yield of 19.5%, although the company’s method of calculating free cash flow might not jibe with mine.

At any rate, Acco Brands offers a substantial free cash flow and office and school supplies are to an extent always in demand. Therefore, I can recommend this stock as a portfolio candidate.

0

CF Industries: Strong Margins Taking Advantage of low Natural Gas Prices

December 2, 2012

CF Industries is the leading North American producer of nitrogen fertilizer. By a miracle of nature, this fertilizer is made out of natural gas and air. Owing to the very low prices of natural gas, coupled with the high acreage of corn expected to be planted in the near future, CF Industries enjoys excellent margins and a free cash flow yield of over 13%. The company also has some facility to protect its margins, as natural gas can be hedged easily.

http://seekingalpha.com/article/1033711-cf-industries-is-an-attractively-priced-fertilizer-company-with-strong-margins

0

Owens-Illinois: An Attractive Global Glass Company

July 22, 2012

Owens-Illinoisis is the leading global manufacturer of glass packaging, with a high free cash flow yield and the ability to pass its inflation costs through to its customers. I highly recommend it.

For my full view on the company, see

http://seekingalpha.com/article/738241-owens-illinois-a-leading-glass-company-at-a-very-good-price

0

Cablevision: Reasonably Priced with Substantial Free Cash Flow

July 6, 2012

I have long been attracted to companies with a high level of free cash flow, and I have found that telephone companies have been a fruitful place to look, as the companies combine a cash flow orientation with a recurrent source of income. And I think cable companies may have similar investment characteristics. There is something to be said for a company that requires an affirmative action from its customers in order to stop receiving service. After all, when I cancelled my cable service it was because I realized that it had been months since I actually watched TV.

My attention was recently drawn to Cablevision (CVC), a company with about 3.25 million customers in the New York City area. The company also offers high speed Internet and VoIP. The company has also recently acquired Bresnan Cable, a firm which supplies several regions in the foothills of the Rocky Mountains. This acquisition was funded through the issuance of debt and improved the 2011 results significantly as compared to 2010. The company’s debt load, although significant, gives every impression of being manageable. Cablevision’s New York operations showed flat or very slight growth as well in 2011.

Cablevision also owns non-cable operations such as a newspaper company, a chain of movie theaters, and a high school sports network. In my opinion these other assets should be divested, as the newspaper company is paying an interest rate of 10%, while the management admitted in their latest conference call that the movie theater chain had a negative EBITDA once the contributions to corporate-level expenses were taken into account. Since a positive EBITDA is just about the lowest hurdle a company should be capable of clearing, the grounds for disposal seem pretty clear.

There is speculation is that Cablevision is trying to position itself to be acquired, and the company has in the last two years spun off Madison Square Garden, Inc., and AMC Networks, a collection of cable channels. Some observes believe that the reasons for the spinoffs were in order to make Cablevision a pure cable company that would be a better “strategic fit.” However, this rumor has been floating around for some months now, and in my view the possibility of a takeover should be a bonus, not the sole reason for investing. However, the company also owns more than 21 million shares of Comcast, which it claims to have received as the result of various transactions. The company has fully hedged this position with futures, but one wonders if the shares serve a strategic purpose.

I should point out before addressing the figures that the company has two series of shares outstanding. There are 217 million class A shares outstanding that are publicly traded and entitled to one vote, and 54 million class B shares that are held by the controlling family and entitled to ten votes. The class B shares are not publicly traded, but may be converted into class A shares on a 1:1 basis.

The company has about $5.2 billion in bank debt, which bears interest rates of a little over 3% on a weighted average basis, not counting the newspaper’s debt I referred to above. However, these debts come with an extension fee of between 2 and 2.5% per year. There are is also $5.4 billion in notes  that have an average interest rate of roughly 8%. However, in the previous year the company refinanced some of its notes at 6.75%. The company’s overall interest rate on its long term debt would be 6.9% based on its first quarter 2012 interest expense, and so it is not evident that the market is punishing Cablevision for its high debt load.

In 2011, sales were $6.7 billion, operating income was $1.23 billion, depreciation was $1.02 billion, and capital expenditures were $814 million, producing $1.43 billion in operating cash flow. Interest expense was $757 million, leaving $683 million in pretax cash flow, or $410 million in estimated after-tax free cash flow, with a tax rate of 40%. All figures are calculated without taking into account changes in working capital

In 2010, sales were $6.2 billion, operating income was $1.19 billion, depreciation was $887 million and capital expenditures were $823 million, producing $1.24 billion in operating cash flow. Interest expense was $711 million, leaving $530 million in pretax estimated free cash flow, or $318 million. I should point out here that this was the year of the Bresnan acquisition, but the company estimates that even setting aside the acquisition, revenues were up 1.2% and operating income was up 2.1%. It is also noteable that the interest coverage ratio based on operating income has barely moved despite the debt-funded acquisition, while free cash flows have improved considerably.

In 2009, sales were $5.9 billion, operating income was $1.06 billion, depreciation was $916 million, capital expenditures were $737 million, producing $1.23 in operating cash flow. Interest expense was $673 million, leaving $562 million in pre-tax cash flow, or $337 million after taxes.

However, in the first quarter of 2012 sales were $1.66 billion, as compared to $1.65 billion in the first quarter of 2011, operating income of $250 as compared to $298, depreciation of $253 versus $243, capital expenditures of $216 versus $131, producing $287 in operating cash flow versus $412. Interest expense was $182 million versus $191 million, producing $105 million in pretax cash flow, or $63 million after estimated taxes versus $221 and $133 million, respectively.

Cablevision’s has explained the decline in operating income as being  largely due to increased operating expenses, specifically $25 million in programming costs, $15 million in operations and network-related costs owing to increased network and customer premises maintenance expenses, and $6.5 million in VoIP-related matters, of which $3 million was an arguably nonrecurring settlement with the New York sales tax authorities. These three factors add up to $46.5 million and make up virtually all the gap in operating income between $250 million and $298 million in the first quarter last year. I should also point out that programming costs are generally charged on a per-subscriber basis, so these are variable costs that can be passed on to customers.

As for the increase in capital expenditures, Cablevision’s management explained during its first quarter 2012 conference call that the purpose of the expenditures was to make key network upgrades and to support their networked DVR system, and that some of the expenditures were for future projects that had been accelerated. However, they also stated that the increased capital spending will probably continue through 2012, although they did not state at what level. I am hopeful that the newly efficient network should reduce operating expenses in future years. In the conference call management also revealed that the company had not thus far announced a rate increase in 2012, which allowed the company to slightly increase its subscriber count but which left revenue relatively flat. So it is not clear to what extent a future rate increase would hamper Cablevision’s customer retention efforts.

The company offers a dividend yield of 4.5% based on current prices and has raised the dividend twice in the last two years by a total of 50%. Cablevision also disclosed in its conference call that it could have further increased the dividend this year, but declined to do so. Even so, management has increased its repurchase authorization and repurchased an additional $49 million, or roughly 1.4% of outstanding shares, in the first quarter. As I’ve said, I’m not that convinced about the wisdom of buybacks as a means of creating value.

So, in terms of valuation, Cablevision is, as I said, controlled by the class B shares. The customary method of handling this is to assign these shares a control premium, which normally ranges between 20 and 50%. I think 30% is a useful estimate. Thus, the 54 million class B shares should count as 70 million in computing relative share weights. Therefore, the remaining 214 million class A shares should have an effective claim of 75.3% of the company.

If I had to estimate the company’s earnings power based on free cash flows, I would  assume that in the near future the company would at least make some attempt to pass on the increased programming costs on to the customers and that the rate increase may have been deferred this year but should occur eventually. Also, I am convinced that at least some of the incremental capital expenditures were based on the acceleration of future projects and so the current expenditure level is higher than would ordinarily be required to maintain Cablevision’s earnings power. As a result, we could split the difference between 2011 and 2012 so far, and estimate the company’s earnings power at roughly $400 million in free cash flow per year. But even as I write this paragraph, I am aware that sound value investing should not rest on too any assumptions, and that a key difference between a value investment and an attractive speculation is the lack of conditional statements. So I do not deny that this stock may not qualify as a pure value play at current prices.

Even so, $400 million per year, capitalized at 10x, would support a value of $4 billion, or $3.01 billion to the class A shares based on the control premium. Based on the current price of $13.25, the current market value of the class A shares is $2.84 billion. So there is a slight upside based on the current earnings power, and a future rate increase would serve to increase that upside.

Therefore, I can say that Cablevision, although perhaps not a pure value play, is a fairly-priced company that offers a reasonably substantial prospect of significant free cash flow generation, and should be a candidate for portfolio inclusion, especially if the share price should fall further.

0

Dell’s Dividend: Why Now?

June 19, 2012

As you may know, a few weeks ago Dell reported remarkably disappointing earnings of 43 cents a share on a comparable basis versus 55 cents in the year-ago quarter, which caused the price to decline sharply. In my view, taking DELL’s substantial cash position into account and even allowing these bad results to be indicative of the future, the company remains dramatically underpriced. Even so, the most disturbing development of the quarter was the negative cash flow from operations, which has not occurred at DELL since the third quarter of 2008, although based on the last few years the first quarter seems to be Dell’s weakest in terms of operating cash flow. Furthermore, the cause of the negative cash flow comes primarily from investments in working capital, which I tend not to place a great of weight on.  Another contributing factor to the decline was a $100 million increase in research and development, which some finance professionals believe straddles the line between expenses and capital investments anyway.

However, last week the company also announced that it was instituting a modest dividend, perhaps intended to supplement or replace the billions in share buybacks the company has accomplished over the recent decade. In fact, Dell has repurchased at least $2 billion in stock in every year since 2001 apart from 2008 and 2009, with a peak repurchase of over $7.2 billion in 2006, and totaling $30.6 billion in net repurchases (repurchases minus issuances) between 2001 and 2012. This figure is significantly greater than Dell’s current market cap.

However, these repurchases have not had their desired effect on the share price, which is nowhere near as high as it was when the repurchasing began. When the dividend was announced, the price received a small boost which seems to have evaporated in subsequent market action. Perhaps this serves to expand the shareholder constituency, as some market participants are restricted to dividend-paying stocks, but those constituents are in the minority and probably would not represent much in the way of marginal buying given Dell’s current unpopularity in the market. This leads us to wonder why Dell should choose now to initiate a dividend.

The conventional wisdom pertaining to dividends is that in addition to returning excess money to shareholders, they also provide information to the investment universe. A regular dividend is something that the company is usually willing to defend even in the event of a downturn, and indicates that a company has a baseline level of earning power that investors can rely on. On the other hand, a company with profitable investment opportunities would be better served reinvesting its cash flow into growth projects, and so a dividend suggests that the company has definitely moved beyond the growth phase and into the mature phase, where growth is likely to be limited to the overall growth of the sector and ultimately the GDP of the target markets. Of course, anyone familiar with Dell would not be surprised by this revelation; Dell’s return on assets according to Yahoo finance is a little over 6% (although setting aside the large cash balance would improve it to about 9%), and its reinvestment rate is lower than its depreciation rate and much lower than its free cash flow. By contrast, share buybacks have the perception of being temporary and perhaps indicative that the company’s free cash flow is nonrecurring (although many, if not most companies nowadays do at least repurchase the shares that are granted through stock options).

Dell has joined Cisco as being a company that has repurchased vast amounts of stock while its share price has declined. However, the question is whether this is a defect in the theory of share repurchases. Basic financial theory holds that a company is worth the money it has plus the present value of the money it will have (positive or negative). In this sense, a share buyback would have the same effect as a dividend; it reduces the value of the remainder of the company by the size of the buyback, and the effect on the share price depends on the price/book ratio and other factors. Aswath Damodaran, author of Damodaran on Valuation: Security Analysis for Investment and Corporate Finance, a useful toolkit of standard valuation techniques, adds the further complication that the market may not value the cash of a company at its face value. He writes that if the market believes that the cash is just sitting there waiting to be wasted by management, shareholders will value it at a discount, making a repurchase (or dividend, presumably) a good move, while if the cash is a strategic asset that will be deployed in value-creating expansion projects, the cash will be overvalued and therefore returning it to shareholders is a decision that would be punished.

In Dell’s case, according to the latest 10-K filing 80-90% of the company’s cash is held outside of the United Stated, presumably to save on repatriation taxes. I have the impression that the market places very little value on it at all, at least unless a repatriation tax holiday is declared. This view may be irrational, considering that the US corporate tax rate is unlikely to rise, so at least 65% of that overseas cash can be counted on.

However, for those of us who reject the efficient market hypothesis there is the additional twist of the value effect of share repurchases. The decision of how to return money to shareholders should depend on whether the stock is cheap or expensive. If the stock is cheap, a repurchase would theoretically benefit the remaining shareholders more. Effectively the company is repurchasing assets that has a market cost of capital of 16% or more (based on the P/E ratio of 6, and that is before adjusting for cash) when the justified cost of capital is far lower. If, however, a stock is fairly priced, management would be better served, or at least equally served, by employing dividends. And of course if the stock is overpriced, management’s best move is to arrange a stock-for-stock merger, as with AOL-Time Warner.

So, from that perspective, and given my view that Dell is underpriced, now is a bad time to divert $500 million, which is about what the proposed dividend will come to in a year, from the repurchasing budget to the dividend budget. If anything, repurchasing would be more effective now at the current price than a higher one. I still think Dell is underpriced even if the decline in earnings is persistent, and this dividend decision won’t push me into selling it, but I still think that now is not the time for a dividend.

Disclosure: At the time of this writing, author owned shares of DELL.

0