100th Poststravaganza – An examination of previous recommendations

January 10, 2011

So, my loyal readers who have been keeping count will know that this to be my 100th post. I thought I would celebrate this exciting occasion with a review of how some of my recommendations have worked out. I know hindsight makes everything look more certain than it was, but it is definitely a useful exercise to see where my investing went well and where it went amiss. So I thought I would look at what price my recommendations wound up at, whether I would have sold along the way, and whether the investing thesis still applies.

I thought it would be best to go by category. My favorite category, of course, is companies with high and stable free cash flows. When these stocks are selling at very low multiples of free cash flow, as they often are, it is the clearest evidence to me that the market frequently and exploitably gets things wrong.

The first example of such a company was Qwest, which I recommended way back in June of 2009. Back then it was at $3.86 cents, and after the CenturyTel acquisition was announced last year, which unlocked a recognition of Qwest’s true value, the company ultimately hit what I consider a fair price of $6.95, and actually moved beyond it. All the while the company maintained its dividend, which at the time of recommendation yielded roughly 8%. I would call that a success.

Windstream, which I recommended in mid-July of 2009 at $8, was a similar success. It is now at $13.50, curiously nearly a dollar off of its peak, and has continued its very generous but well-covered dividend of 12.5%. As I calculated, it is perhaps finally fairly valued based on its recent free cash flow levels, and I will want to see how its acquisitions contribute (or fail to contribute) to future earnings levels. Unfortunately, Windstream’s recent acquisitions have largely been of private companies which have not released sufficient data to allow me to value them independently. Even so, I cannot say that Windstream is definitely overpriced and therefore I will continue to hold it.

The next idea in this vein was Compass Minerals, from late August 2009. At the time they were at 52.56 with a P/E ratio of 9.5. After my recommendation they spent a lengthy period drifting more or less straight upward to a little over their current price of $87.79 and a P/E ratio of over 19. Not bad, one might say, but I should point out that although salt for roads is an essential product, and although Compass Minerals holds some of the most lucrative salt mines in the world, salt is inexpensive and bulky enough that cost of transporting it limits the geographical area that the company can cover. Also, global warming or not, demand is also subject to physical limitations, and of course state and municipal budgets are under pressure. As a result, I would call Compass Minerals overpriced now and would definitely have called for selling it somewhere along the way up.

My next discovery was Breitburn Energy Partners at the end of September 2009. This was a textbook value case. Its management had decided to suspend its dividend for liquidity reasons, which caused a mass exodus of investors despite the fact that Breitburn was still making the same money, just not distributing it. At the time they were selling at $10.83, and are now selling at $21, as they were able to resume their distributions, although not at their historical level of 50 cents a quarter. They hold a number of long-lived assets and engage in a number of hedges to lower their exposure to falling oil prices. They have an earnings yield of around 10% at present, which makes me at least consider selling. However, Linn Energy, another recommendation of mine in a similar vein (went from 22.04 when I recommended them to a present 38.21), and I sold them only when their earnings yield dropped to 8%. So, their hedging strategy does give me some confidence that their cash flows will be stable enough to justify a lower than normal earnings yield, and based on Breitburn’s current earnings an 8% yield would put the target price at around $25, so there is still an upside here.

Just so you don’t think this post is solely about bragging, there are times when this strategy has not (yet) produced results. Chiquita Brands has an attractive present and prospective earnings yield, with a price/free cash flow ratio of 6 when I recommended it. Earnings have declined somewhat as a result of weak pricing in Europe, but on the whole the company still has an attractive price/free cash flow ratio, and when Europe implements the tariff liberalization that the WTO forced on them, I expect that earnings will improve further. Furthermore, as 2/3 of their sales are in Europe, investors who are concerned about the future of the US dollar might find them attractive on this ground too. Nonetheless, I recommended them in February 2010 at 15.13 and they are now at 13.82. I remain confident that their true earnings power will ultimately be recognized by the market, and of course the essence of value investing is that individual market participants can decide that a company is attractively priced without the need for the market to immediately confirm it.

On the whole, though, I have found that these pure free cash flow plays have produced more than satisfactory results, and from among the various categories of stocks I consider, they give me the greatest confidence of good results.

Alongside these companies that are cheap based purely on free cash flow, I have examined on this website companies that do not necessarily offer outsize free cash flow yields, but also have other attributes that make them attractive.

The first such stock is Rayonier, which owns a large amount of timber acreage and has a vertically integrated paper and wood fiber products operation. The large holding of land serves as an excellent hedge against inflation, which could justify a larger multiple. When I recommended it in August of 2009 it had a P/E ratio of 20 and a price of $39.93. They have had some earnings growth, but the price has been propelled to $57.35. The current price/free cash flow ratio has declined to approximately 16, although capital expenditures are not lower than the historical levels. Even so, I do not feel comfortable projecting continual growth, and as I have a sanguine view of inflation I would say that Rayonier is somewhat overpriced at this time.

The second such stock is Ross Stores, which I recommended on the grounds that as a discount store, its competitive position becomes stronger during a recession. In the jargon of Wall Street, then, it is a countercyclical stock. Last December when I suggested it, it had a P/E ratio of 13.6 and a price of $42.37. Now it is at $63.95 and, thanks to some sales growth and store openings, earnings have increased, allowing Ross to retain a P/E ratio of 14.5. I wonder, though, how many customers will go back to non-discount stores when the economy improves, and how many customers, like me, enjoy the treasure hunt aspect of Ross and would shop there regardless.

Even Seth Klarman has advocated that finding cheap hedges where they are available should be part of a value strategy. As a result, companies that by dint of their assets or market niche offer additional protection from certain events occurring would perhaps be entitled to a premium. However, it would be dangerous to take this too far; a company’s hedging characteristics should serve as a sweetener and not itself the basis of an investment.

My third category of stocks I considered bargains based on balance sheet characteristics. These companies have a long history in value investing circles; Ben Graham himself liked the idea of net-nets, companies for which the net of their cash, receivables, and inventories over all of a company’s liabilities is still less than the company’s market cap. In a normally functioning market these situations are definitely anomalous, and are often indicative of some weakness, impending negative contingency, or inaccuracy in the accounting itself. However, if the companies are profitable and operationally sound, a set of them should in theory offer attractive results as the market anomaly, or at least the market pessimism is resolved. And at any rate, the earnings of the company itself perhaps can be discounted at a lower rate than the usual equity rate because the stock is already trading at below the theoretical price floor. My returns from this set of recommendations is perhaps significantly below that of the pure free cash flow plays, although the timing of the recommendations, when the market returned to normalcy and then to what looks like great optimism in the present situation may have something to do with it.

The first net-net I recommended was Keytronic at $2.38, which at the time had a net current asset value of $3.37. When a quarterly earnings report indicated that Keytronic was returning to its normal earnings power, that gap was resolved very quickly. The stock is now at $5.62, but its current net current asset position is $37.3 million, which is a share price of $3.60. Keytronic has got its earning power back into gear, having produced $6.18 million in earnings for the last four quarters (after applying a tax rate of 35% to their pretax earnings, as they received a large tax refund in the 3rd quarter of 2010). This gives them a P/E ratio of 9.41. However, Keytronic has also made a significant increase in capital expenditures, which has resulted in free cash flow generation for the last four quarters of only $3.4 million. It may be that they are expanding their capital in the face of new business opportunities and earnings growth, but conservativeness calls for being suspicious of this opportunity and viewing all of this expenditure as merely necessary to maintain current earnings. This being the case, the net-net thesis and ordinary free cash flow analysis call for the stock to have been sold at a lower price. On the whole, though, this was a successful recommendation.

My next recommendation in this vein was the very small Coast Distribution System (CRV), which I recommended at the beginning of 2010. It had a market cap of $17.4 million and had a net current asset value of $25.6 million. The company is still profitable, having a present free cash flow yield of just under 7%; however, prices have moved from $3.91 when I made my recommendation to a whopping $3.99 today. Even so, the net current asset position is still $25.7 million so this experiment, although not successful, is still ongoing.

Jewett Cameron, another tiny company in this vein, showed better results. At the time I recommended it in February of 2010, it sold at $6.21 with a market cap of $14 million and a net current asset position of $16 million. They also offered a P/E ratio of 7. Now they sell at $9.36, or $21.6 million in market cap. Earnings have been flat, giving them a current P/E ratio of 11.28 and its net current asset position of $17.3 million, so I would probably have wanted to sell somewhere along the way up.

The final entry in this field is Microfinancial, a company that finances business leases. It was recommended at the end of January 2010 at $3.21 and it is now at $4.04. The P/E ratio still stands at 11 and a half and the company, which was at a 40% discount to the net value of its loan portfolio at the time of recommendation, is still at a 17.5% discount to its asset value. However, as a financial company the book value of its portfolio is unreliable and subject to writeoffs, so Microfinancial should perhaps not be taken at face value.

On the whole, though, I think the results of this foray into net-nets can be pronounced a success, particularly since these results are theoretically less dependent on shifts in market sentiment.

The next category of stocks I have considered are companies that operate domestically in China. The stocks are cheap by the numbers, frequently with single-digit P/E ratios and rapid growth. However, upon consideration I have found that the legal issues surrounding these stocks, specifically the difficulty of actually getting money out of China, the fact that many key players are outside of the SEC’s jurisdiction, and finally the fact that China is inevitably a bubble, has caused me to consider that the attractive valuations are an insufficient attraction. Unfortunately, the stocks have not given me some face-saving performance until I have reached this decision. American Lorain, which I recommended in October of 2009, has gone from $3.01 then to $2.65 now. Skypeople Fruit Juice, recommended in April of 2010 at $6.15 is now at $4.33. China Security and Surveillance, recommended in May of 2010 at $5.16 is now at $4.97. And finally, HQ Sustainable, also recommended in May 2010 at $5.49 is now at $4.89.

Another category with disappointing results has been in my short recommendations. As I stated before the market has moved from pessimism to startling optimism, and of course the companies that trade at high valuations, which attract optimists already, have not been immune to this trend. The trouble is that the higher the stocks go, as long as earnings or prospects do not improve, the more obvious the short theory becomes even as the losses accumulate. Now, given the results from the long side, one is left to wonder why I would even consider it necessary to be short. However, there is evidence that a long value/short strategy generates outperformance, at least in flat markets, and I am led to believe that my results from some of my value stocks are atypical.

The first short candidate, in June of 2009, was Coinstar. At the time it was at $25.91 and now it is at $57.58, most likely from the spillover effect of Netflix. I suppose that technically I never did recommend covering, but in 2009 the stock began advancing immediately after I made my call, only to drift back downwards after a disappointing third quarter. I was able to cover at a small profit at that point. Their free cash flow is still virtually nonexistent, and earnings are perhaps a little better than last year as compared to last year as sales are up.

The next set of short candidates comes from the tech sector. The market optimism seems to naturally gravitate towards anything that shows signs of growth, and in theory businesses expanding their computer capital is possibly in the offing as the economy recovers. However, these firms still trade at ridiculous cash flow multiples that would not make sense even if these companies produce every quantum of growth that they are projecting. In September of 2010 I suggested shorting Concur, which sells expense tracking software…in the cloud! At the time it was at $52.01 and is now at $53.53. Red Hat, the open source Linux provider, I suggested shorting the very next week at $40.82, and it is now at $45.71. I suppose I can comfort myself that Concur has failed to beat the market, and Red Hat has matched it over the period studied. Netsuite, however, I recommended shorting in November of 2010 at $25.10 and it is now at $28.15. As these are recent positions and very little in the companies’ prospects have changed, I believe that this trade is still “alive.” But I do recall that in early October a firm named Equinix, which provides data center services to enterprises, made a surprisingly bad earnings announcement that knocked Concur, Red Hat, and a number of companies active in the cloud computing space down by about 6%. I remember thinking that it would probably have been a good time to take profits. Normally I would like to think of shorts as a lengthy commitment, but past experiences have convinced me that it might be better to take profits where I can find them. Of course, my past experiences have been during a bull market.

My next category of shorts have been cell phone tower companies. The tech companies have generally pristine balance sheets, indicating that the investing community that may be fool enough to buy them is still smart enough not to lend money to them. However, the cell phone tower companies I identified have convinced people to lend them money, and perhaps too much money as they are approaching the limit of their debt covenants. In October 2010 I suggested shorting SBA Communications at $40.28 and it is now at $39.66, and later that month I suggested shorting Crown Castle at $42.74 and it is now at $42.60. I don’t think anything at these companies has improved to the point that it would justify multiples of more than 30.

Although I think of all these stocks as potential short candidates, I have been considering the wisdom of taking the short side of stocks using long-dated puts instead of ordinary short selling.

The final category of holdings that interests me is junk bonds, and those have been going very well. Value investing techniques do not apply only to stocks, and junk bond investing, although it requires at least conversance with the US Bankruptcy Code, offers lucrative opportunities particularly in periods where the market is seen as coming out of recession and returning to normalcy.

My very first recommendation on this site was in fact junk bonds, specifically the bonds of Bon-Ton department stores at $46 and with a yield to maturity of 34%. The bonds currently trade at 102.75 and yielding about their 10% coupon. The total return from this transaction, counting interest payments, is roughly 146% over a year and a half, a very satisfying result. However, on reflection they do not have the bankruptcy robustness at least on the income side, as interest is covered approximately once. At the time of the recommendation the asset side looked a little more promising, although with the bonds at par I don’t believe the asset coverage picture is so attractive. At any rate, obviously with the bonds trading at par there is little upside, apart from the 10% coupon itself, in them and therefore it might be time to exit the position and find more fruitful locales.

My next idea in August of 2010 was the bonds of Western Refining, a small oil refining company. At the time the bonds were selling at 76, and according to finra.org the bonds recently traded at 120. The bonds are convertible, and they have recently crossed the conversion price of $10.80. The yield based on the current price is actually negative, which leads me to believe that the bond price now entirely represents the stock value. At any rate, I believe that the bonds, which are not fully robust to bankruptcy, to be definitely overpriced at this point.

The next junk bonds that intrigue me are my Indian casino bonds, from both the Mohegan Tribal Gaming Authority and the River Rock casino. There was a recent article in the Wall Street Journal about the risks faced by certain Indian casinos, and of course although the figures indicate bankruptcy robustness for both casinos in terms of cash flow production, no Indian casino has ever actually gone through the Chapter 11 process. However, I will say that my opinion is that no stakeholder in an Indian casino has any interest in seeing a liquidation. Mohegan has several series of publicly traded debts which at the time I recommended them at the beginning of September of 2010, ranging from around 60 to 80. Since then the price has finished up about five cents up for each issue. As for River Rock, the bonds were at 84 when I recommended them, and after the article was written the bonds were briefly catapulted up to 96, although the spread widened to a whopping eight points (I can’t help but feel partly responsible). The bonds have since settled around 90, perhaps owing to a downgrade from B+ to B-. However, I think that both of these issuers have every potential of being paid off at par and are likely not to lose any significant amounts in bankruptcy. Therefore, these bonds at least remain attractive.

So, although it is difficult to tell anything for certain based on a year and a half of market conditions that were unusually unusual, I think this is a useful exercise to determine what techniques of value investing have worked and which play well with my toolbox of approaches. I will definitely have to do more of these reviews in future.

1

Smart Modular Technologies is a smart (and modular) choice

January 3, 2011
Tags: ,

A new year is upon us, and with it, a new set of investing opportunities. Actually, most of them are the same opportunities that existed last year, but the prices have changed and that makes all the difference. Actually, I have been noticing lately that I have been finding fewer attractive opportunities, as a result of a continuing stock market advance. I have been selling certain positions, including Linn Energy and Qwest, and not replacing them. I would rather incur opportunity costs than risk losing money by lowering my standards.

However there remain some opportunities out there on an absolute as well as a relative basis. One of them is Smart Modular Technologies (SMOD). Smart Technologies makes memory modules, particularly DRAM, and also makes solid state products including hard drives and embedded flash devices. They also perform design work to facilitate integration of their products into their clients’ products, and provide other services such as supply chain management and other services relating to their products. Their current operating focus seems to be moving into Brazil.

The company’s operating figures paint an attractive picture, with a P/E ratio of 7.3 and a market cap of $373 million. HP, Cisco, and Dell have collectively accounted for roughly half of their sales. Obviously, as they provide for the consumer and enterprise markets, their sales have been fairly volatile, having increased 59% for fiscal year 2010 as compared with 2009, while 2009 sales decreased 34% from 2008. Volatility in DRAM prices also produces a great deal of volatility in sales, and as Smart has recently announced a continuing drop in DRAM prices that is affecting them and all their competitors, which is weighing on their future prospects.

As Smart has cyclical operations, it is difficult to think of a particular year as representative of overall earnings power. As a result, it may be more appropriate to examine what their overall margins have been over the last few years. Gross profit margins were 17.4% in 2006, 17.7% in 2007, 17.9% in 2008, 20.4% in 2009, and 23.6% in 2010. In terms of operating expenses, lately R & D has been up from $15 million in 2006 to $25 million last year. The last five years have also included various nonrecurring or noncash events such as goodwill impairments and restructuring charges. If we remove them, as well as general and administrative costs, we have operating margins of 7.7% in 2006, 8.7% in 2007, 5.9% in 2008, 3.3% in 2009, and 11.5% in 2010, and an average level of 7.4%. Interest has been covered amply in every year, and as Smart Technologies operates in a number of taxing jurisdictions their tax rates have frequently deviated from a kosher 35%. Based on projected sales of roughly $700 million, this produces projected operating earnings of roughly $52 million, which, after roughly $5 million in interest payments and taking out a third for taxes, we have theoretical income of roughly $32 million.

Now, I don’t mean to project that Smart Technologies will actually have net income of $32 million next year, or any year, for that matter, but that is, I think, a fair estimate of their earnings power based on the current situation. Furthermore, given that their five year history includes 2008 and 2009, there could be an argument that the five year averages are lower than their true earnings power, and as a result we could perhaps justify some optimism. At any rate, $32 million set against a $373 million market cap is an earnings yield of 8.6%, which is reasonable, if not particularly attractive. Also, depreciation has been more or less tracking capital expenditures, so there is no additional source of free cash flow.

What makes this company intriguing, though, is its strong balance sheet that is heavily tilted towards current assets. Based on their recent results, they have $93 million in cash and $179 million in receivables, as well as $103 million in inventory, total $375 million. Total assets come to $482 million, and they have $163 million in total liabilities, of which $81 million is accounts payable. This high level of cash and receivables should give buyers confidence that the existing value is safe. Although their inventory, or at least the DRAM part of it, is somewhat volatile and could be subject to write-downs, the fact remains that current assets minus total liabilities comes to $212 million, more than half of the current market cap.

As I stated before, they have recently been focusing their operations on Brazil, and indeed non-US sales represent more than 70% of their total sales. This may be an attractive trait for investors who wish to avoid exposure to the dollar.

The results for the first quarter of fiscal year 2011, which ends in August, are in line with 2010’s excellent results, with nearly $8 million in reported earnings, or $32 million per year. They claim that there was an infrequent and nonrecurring expenditure of $7.5 million for a “technology access charge” for technologies they will be using in their development of solid state products. Now, this amount may be nonrecurring in that they probably do not intend to incur this particular expense again, but it may be recurring in that they will incur technology licensing fees in future. At any rate, this expenditure is directed towards developing more solid state products. Now, on the whole, companies that run diversified lines of business for the sake of diversification alone tend to have their schizophrenia punished by Wall Street, and my holding of Seagate may indicate that I am skeptical that solid state is the inevitable wave of the future–and if it is, it is still hard to tell who will ultimately be the victor. However, it may be in Smart’s interest to lower its exposure to the volatile DRAM prices that caused it to lower its estimates for the year. At any rate, first quarter results do confirm my existing assessment of Smart’s earnings power.

As a result, I can say that Smart is a well-positioned, safe, and reasonably high yielding company with a solid position, and therefore should be considered for portfolio inclusion.

0

Supervalu: Speculating in a grocery store with indigestion

December 22, 2010

I find very often that I seem to be the one who is interested in the investments I’m interested in. Certainly that is true of the River Rock and Mohegan casino bonds, where I seem to be the only person on the Internet who has even considered their investing attributes. So, when I find people actually looking at the kinds of things I look at, I feel a combination of gratification that my views are common, and concern that perhaps my investing thesis is too popular and has already been priced in.

Recently there has been a spate of articles about Supervalu (SVU), a supermarket chain and grocery wholesaler that has been going through some difficult times lately, partly as the result of an acquisition of Albertson’s that imposed a high level of debt (you may recall that Damodaran demonstrated in his useful Investment Fables that more than half of all mergers fail to add value), and partly because of an overall decline in sales. Although some of this can be attributed to the slow economy, the decline has fallen lower and lasted longer than many of Supervalu’s competitors.

The effect of these results on their stock price has been dramatic.  The company has a P/E ratio of 4.67 after adjusting for a goodwill writeoff, and their free cash flow picture is even more attractive. But on the other hand, they have a high debt burden that they are whittling away at but which is causing some concern about interest coverage issues, the decline in sales has of course led to a decline in profits, and presumably there is a limit to how low they can cut capital expenditures.

Supervalu saw a decline of about 10% of sales between fiscal year 2009 and 2010, but as some of its stores have been closed or sold off, same-store sales have declined by about 6.7%. Setting aside a goodwill writeoff, reported operating earnings have declined from $1.4 billion in 2009 to $1.2 billion in 2010, a decline of about 15%, which follows a similar proportionate decline from 2008.

Supervalu’s interest requirements of $576 million that year were thus covered by earnings a little over twice, but the company also has $150 million in operating leases, and at least some fraction of that should be considered interest rather than an operating expense for calculating coverage of fixed charges. This would lower the fixed charge coverage ratio. Offsetting this inclusion was a depreciation and amortization charge of $950 million but only $680 million in capital expenditures in fiscal year 2010. This level of capital expenditures is lower than the historical averages, but as the company is closing stores and reexamining its operations I think we can take reduction in capital expenditures as a somewhat permanent feature. This amount improves the interest coverage by another .5x, and it ultimately produces pretax cash flow to equity of approximately $900 million, or about $600 million after taxes, for 2010. This money, plus any proceeds of divestment, are available for paying down debt, and this what Supervalu has been doing–$900 million in 2009 and an additional $360 million year to date 2011.

Speaking of fiscal year 2011, year to date sales are down a bit less than 10% over last year, and operating income is down about 15% again, $504 million as compared to $607 million last year. There is an additional $188 million in excess depreciation as compared to $119 million last year, as Supervalu has apparently ratcheted down capital expenditures further. So, free cash flow to the firm is reduced by less than sales, at $692 million year to date this year and $726 million year to date last year. However, year to date capital expenditures dropped by 21% as compared to last year, and I am not sure how much capital expenditures can be cut without seriously affecting long-term earnings power, or whether the firm’s management has any better awareness than mine. At any rate, interest year to date is $303 million, producing interest coverage of 2.28x and pretax free cash flow to equity of $389 million, or roughly $260 million after taxes. On a full-year basis this translates to $520 million in free cash flow to equity and a price/free cash flow ratio of 3.61.

It is clear the the market is anticipating future declines in free cash flow, as shown by the market prices of Supervalu’s debt. As a result of the Albertson acquisition and certain other capital structure issues, they have a large number of debt issues outstanding. The notes due in 2012 sell at above par and a yield to maturity of 6.1%. However, the notes due in 2014 sell at below par with a coupon of 7.5% and a yield to maturity of 8.6%, and the notes due 2016 also sell at below par with a coupon of 8% and a yield to maturity of about 9%. In all, nearly half of Supervalu’s $6.6 billion in debts falls due within the next four years or so, and with free cash flow declining it is not clear that Supervalu can pay down this debt out of their cash flow, and may be forced to tap their credit facility, which will have $1.128 billion available in borrowing capacity, or rolling the debt forward at what current market sentiment suggests would be a higher interest rate. They could also provide for debt repayments out of asset sales, an area that the firm is also exploring. However with the aggressive repayment of debt that Supervalu is pursuing, in the space of a few years assuming that nothing derails the plan, Supervalu’s debt could be whittled down to a more manageable level.

The company claimed in its most recent earnings call that there were signs that same-store sales declines were decelerating. However, to assume that the 3.61 price/free cash flow ratio is at all meaningful, we must assume that management is ultimately capable of arresting the decline not only in same-store sales, but in total revenues, which would require their divestitures and store closings to run their course, and also of avoiding any disruptive credit issues like a bad refinancing or having to renegotiate their debt covenants. Even so, if the 3.61 price/free cash flow ratio is a permanent feature, we can calculate that the market is pricing a permanent decline in free cash flow to the firm of 17.7% a year, as a firm’s earnings yield assuming a stable growth (or shrinking) profile should equal the required return on equity (10%) minus the company’s growth rate (here negative).  I find this outcome is unlikely considering that the decline in free cash flows is already slower than that.

The real risk that concerns seems to be is that future developments will push the firm into distress and liquidation. As Damodaran reminds us in the chapter on declining companies in his useful toolkit, The Dark Side of Valuation, which contains advice for valuing companies in various states of their life cycle including the distress situation, it doesn’t matter how pessimistically we discount for earnings in year 5 if the company risks liquidation in year 2. Although the debt situation is stable, the decline in earnings has not been arrested and anyone purchasing Supervalu is probably going to have to assume that revenues and earnings will flatten and possibly even recover at some point in the future.

The prudent value investor does not rely on future projections that such an event will or will not occur, but as long as the company can continue its rapid pace of paying down debt, the company’s situation seems to be improving with each passing quarter. The company’s cash flows will definitely support the current levels of equity and debt, although interest coverage is lower than one would normally like to see. As a result, I can say that Supervalu is an attractive candidate for portfolio inclusion as it has a large upside and is still selling at a price far below the decline in earnings. However, as investing in this company requires a certain optimism, or at least not-pessimism about the future, there is a speculative element introduced that prevents this firm from being a pure value investment.

0

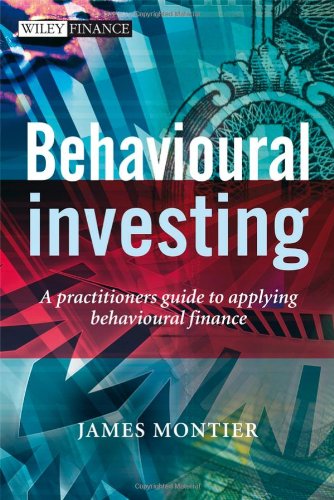
A review of James Montier’s Behavioural Investing, pub. by Wiley

December 12, 2010

Behavioural Investing by James Montier is a weighty book with much to tell us about an aspect of investing that has long been overlooked. Behavioral investing, of course, is basically determining why market participants do not act in a manner consistent with the fancy equations of the financial economists, as they frequently don’t. Of course, overreliance on these equations was a major contributor to the subprime crisis and the blowing up of any number of individual market participants even in good times.

Now, no one would describe his or her investing style as “behavioral,” but all fundamentals-based investing styles are ultimately behavioral in that they believe that the market is generally incapable of pricing certain companies properly. Growth investing assumes that markets underprice growth (a ridiculous view; if there’s anything markets overprice, it’s growth), and value investing assumes that markets misprice everything, but especially lack of growth. Montier himself follows a value approach, which gives his book a pleasing smugness that we value investors are accustomed to.

Much of the book contains details of psychological experiments, many of which have nothing to do with finance or markets but that reveal useful information about human psychological biases. Most important is the conclusion, borne out by experiment after experiment, that giving people more information tends to make them more confident about their conclusions but almost never more accurate. Those of us who don’t have a department full of equities researchers should be comforted by that view. Furthermore, people tend to confuse confidence with ability, which makes, say, talking to management a dangerous distraction.

He also has experiments dealing with market professionals that showed that the slightest bit of uncertainty inevitably produces bubbles. He described a game with a hypothetical “stock” that had equal probabilities of paying one of four dividends for a number of rounds, with the company being liquidated at the last dividend. Obviously, it is possible to calculate the expected value of each dividend and play the game accordingly, but he found that only graduate economics student actually played the game that way. First year business students managed to create a bubble that peaked at over 30 times the correct value, a result that was only beaten by CEOs, who created a peak at over 50 times the correct value. Think about that the next time the CEO of your favorite company announces an acquisition.

The meat of the book, though, deals with how these psychological biases and other typical market behaviors affect market performance, and in here there is much useful data to be found. He takes on the statistic that most mutual funds fail to beat the market by showing that most mutual funds have become passive indexers with a portfolio with over a hundred stocks that, coincidentally, belong to their target index. Such companies, he demonstrates, will automatically fail to beat the index by roughly the amount of their management fees, as expected. However, mutual funds that actually try to pick stocks have a tendency to earn their fees and more. He also includes an article showing that companies that are being sold by institutions do better than companies being bought by institutions, as institutions are more likely to sell companies with value characteristics like poor liquidity and low historical growth.  All of these are amply supported by historical data.

One of his interesting points is that value investing can be looked at as “time arbitrage.” I know that in a world dominated by the efficient market hypothesis, successful value investors should not exist, so one wonders if the concept of arbitrage is the only way their existence can be justified to the efficient marketeers. However, he also found that time is the friend of value investors but the enemy of growth investors. At any rate, a major behavioral bias is that market participants have no patience either for short-term losses or waiting for profits, and that people are not instinctively capable of sorting out complex cause and effect. A shabby stock that has a compelling story attached to it is much more attractive than a compelling value stock without one. Also, he found that fund managers who have done well, with three years of outperformance that has catapulted them to a better job, tend to show no outperformance afterwards, while fund managers who have been fired for incompetence tend to beat the market after they find a new job. Clearly, this is a demonstrated inability to deal with probabilities and to assume that something as complex and difficult as the markets is a deterministic process.

At any rate, the list of biases is long and difficult to categorize, since he stated in the outset that the book was written for an audience of professionals who may not have the time to sit down and follow the complicated threads of an argument through an entire book, so the chapters are brief and pretty much always self-contained essays. Of course, Charlie Munger says that he has never known anyone successful in a field that requires broad knowledge who does not read pretty much all the time, so one would expect these professionals to make time. But as behavioral investing is a broad and discursive field of study, the book probably benefits from keeping topics separate and not attempting to create a unified theory.

In all, I would say that the book is a useful guide to identifying biases that we bring to the markets and to exploit the biases of others. I should point out that many (but not all) of these mistakes can be summed up as failure to employ value investing, but that could just be a confirmation bias on my part. Montier’s Behavioural Investing would be a useful addition to any investor’s library.

1

Windstream – To sell or not to sell

December 12, 2010

Some people think the reason for value investing’s unpopularity is that it’s pretty boring. No excited conversations with analysts, no being wined and dined by management, no building of gleaming, elegant, projections going years into the future; just you and your calculated value to compare to market prices. However, this approach led me to buy Windstream (WIN), which I originally picked up in May and June of 2009 when the market was recovering, at an average price of about $8.60, and with the current price of $14 I’m sitting on about a 60% gain plus having taken down an 11.5% yield for the last year and a half. I don’t actually consider that boring, but I am reliably informed that these results aren’t typical, although there’s no reason why they shouldn’t be.

But I’m not writing this just to brag; the fact that Windstream is now at the highest price it’s been for some time and I need to consider whether I should get out or not. Certainly Windstream offers one of the highest dividends in the market that I view as stable and sustainable and so the question might be asked if I get out of Windstream what would I put my money into instead? However, there is no shame in holding cash until a better opportunity comes along, and a stock should cheap on its own merits and not simply as compared to something else.

Now, a high dividend payment is indicative of earnings stability, as the market tends to punish the prices of companies that cut their dividends (although counterexamples can be found in 2008), and managers are aware of this. However, I view high and sustainable free cash flow as a sine qua non of an equity investment, not a bonus, and so I would be unwilling to attach a premium to it.

The free cash flow picture of Windstream is complicated in that they have gone through many acquisitions of smaller companies recently, most of which have been privately held and therefore have no publicly available financial statements, and the summarized financial data do not give sufficient information to calculate free cash flow, regardless of synergy. The new and undigested acquisitions may have something to contribute to earnings, and certainly give rise to integration costs that should be viewed as nonrecurring.

So, in 2007, free cash flow net of nonrecurring costs were $610 million. In 2008, the figure was $604 million. In 2009 it came to $594.7, and in 2010 year to date it comes to $503 million, which is $670 million on an annualized basis. Of course, Windstream has issued a number of shares to pay for its acquisitions, so free cash flow per share has not necessarily improved.

Currently, there are 483.5 million shares of Windstream outstanding at a price of $14 each, producing a market cap of $6.77 billion. This is a multiple of almost exactly 10x current free cash flows. Ten times earnings I consider a fair price, not necessarily a cheap price to pay, particularly as I am skeptical about most growth opportunities to the point that I generally try to avoid projecting any growth at all in order to justify a purchase. Of course, in this low interest rate environment a high free cash flow yield like Windstream’s might justify a higher multiple, but such a view easily sets off a slippery slope.

So, I am not inclined to sell Windstream yet, but I would consider selling if the price moves significantly higher.

0

They won’t buy Seagate, but I won’t sell it

November 30, 2010

It appears that Seagate (STX) will not be taken over after all, as it has rebuffed its
buyers for not meeting their price. The stock price seems to have taken this
development in stride, dropoping only 3.25% today. However, the market’s incurable
impatience had already caused the price to drift down from the $15 level it had
reached after the buyout was announced. But the question remains of what to do now.

It would not surprise me if the price fell even lower, particularly as there seems to
be a gloomy sentiment hanging over the market. Actually, Seagate is headquartered in
Ireland, which doesn’t seem to have entered the public’s consideration but one never
how the investing public’s mind will choose to connect the dots in future. At any
rate, I do not feel that this event is a setback, as my investment thesis for Seagate
never centered on its being a buying candidate. I simply identified a company with a
free cash flow yield of about $1 billion per share, with an extra billion in cash on
the books, selling for what was at the time about $5 and a quarter billion.

At this time, the first quarter 2011 cash flows were below the historical trends, as
capital investments and operating expenses were both higher than the historical
results. I do not feel that a single quarter’s results affect the analysis that much,
but I think some monitoring of the situation is in order. But leaving that aside, the
company is still selling for $6.34 billion, which is a P/E ratio of 6.3. And, as
their levels of cash on hand are roughly $1 billion over their historical level, the
prospective yield is even higher.

On the other hand, the market seems to have decided that solid state drives are the
wave of the future and that anything that is not solid state is doomed. Of course,
Seagate has some solid state products. Moreover, it seems to be the trend of all
storage devices to inevitably become cheaper, so it may be that a conservative
earnings multiple would be lower than for most companies. Even so, I think that six
is too low for one of the two leaders in the hard drive industry.

The firm did announce a $2 billion share buyback, presumably in order to soften the
blow. As the stock is apparently underpriced, it is probably as well for the company
to buy back shares while they are cheap. Even so, I think of share buybacks as a lazy
step for management, who can think of nothing to invest their money in but who for
whatever reason are unwilling to commit to a dividend. Still, the high and fairly
stable cash flows of Seagate are attractive to me, and I am definitely not going to
sell based on this announcement.

0

Where is the Money? The Short Case for Netsuite

November 23, 2010

Netsuite is a company that produces an integrated suite of business applications for medium sized businesses. Within this core area they also produce industry-specific applications, and also a platform that allows for customer-driven development. The company was born in 1998 and seems to have brought some of that era’s valuation with it, as the company has a price/sales ratio of 8.75 and a price/free cash flow ratio of about 170. Revenue growth has been very impressive, increasing from $17.7 million in 2004 to $166.5 million in 2009. However, this growth has not yet produced any tangible benefit to the shareholders, and one wonders when the shareholders will run out of patience.

The company has an impressive rate of sales growth, but this revenue growth has not translated into increased earnings. To be precise, this revenue growth hasn’t translated into earnings, period. As James Montier noted in his excellent Value Investing, a low price/sales ratio doesn’t necessarily mean a cheap stock, as the metric does not take into account capital structure or profit margins.However, a high price/sales ratio is a sufficient indicator of an expensive stock, since no capital structure or realistic margins will produce the earnings necessary to justify the price. At 8.75, Netsuite’s price/sales ratio is one of the highest to be found in the U.S. market.

Turning to the earnings picture, it is normally helpful to use a proxy for free cash flow, which is earnings plus depreciation minus capital expenditures. Looking at this measure, we find that Netsuite actually isn’t producing any free cash flow. In 2007, Netsuite reported earnings of -$23.9 million, took $3.4 million in depreciation and amortization, and made $4.6 million in capital expenditures, resulting in free cash flow of -$25.1 million. In 2008, Netsuite reported earnings of -$15.9 million, took $6.9 million in depreciation and amortization, and made $7.3 million in capital expenditure, producing total free cash flow of –$15.5 million. In 2009, reported earnings were -$23.3 million, plus $10.7 million in amortization and depreciation and minus $6.1 million in capital expenditures, producing estimated free cash flow of -$18.7 million. Year to date 2010, the figures are no better despite the continuing trend of sales growth. Reported earnings for the first three quarters are -$21 million, plus $9.3 million in depreciation and amortization, minus $4.7 million in capital investments, total -$16.1 million, which would be -$21.4 million on an annualized basis.

Of course, it should be noted that much of the reported earnings losses spring from the fact that Netsuite is very good at handing out stock-based compensation. Given the high share price of Netsuite it is probably good for the company to hand out stock instead of cash, but from a shareholder’s perspective dilution is still dilution. If we set that aside, and add back in all the stock-based compensation, we find that in 2007 the company would still have earned -$7 million in 2007, -$4 million in 2008, $2 million in 2009, and $7 million year to date in 2010–equity-based compensation, at $23 million year to date, is more than 50% higher than it was last year at this time. It is not immediately clear to me what is the benefit to the shareholders from handing out stock-based compensation at a higher rate than the cash generation that the management is being compensated for, but that is the Board’s decision and they show no signs of changing it. At any rate, even if we neglect dilution, $7 million in cash flow is about $9.3 million on an annualized basis, and weighed against the company’s current market cap of $1.61 billion gives us a price/cash flow ratio of 173, a figure that strikes me as rather high.

I suppose that Netsuite’s sales growth may eventually produce better returns, and perhaps even positive earnings. Also, perhaps the last three years have been bad times for businesses to make major new investments (not that Netsuite’s 2005 and 2006 figures have shown positive earnings, either).  But it seems to me that Netsuite’s current valuations can only be justified by wildly hopeful expectations.

And as to this rosy future, I will also note that in the 2009 10-K the company noted that “As a result of continuing losses, management has determined that it is more likely than not that the Company will not realize the benefits of its domestic deferred tax assets and therefore has recorded a valuation allowance to reduce the carrying value of these deferred tax assets to zero.” As the company discloses elsewhere in the same document, the operating loss carryforwards expire between 2018 and 2029. This means that, as they are fully written off, the company is saying that it cannot be more than 50% sure that it will achieve profitability under the Tax Code even by 2018 or later. Obviously, these projections are subject to revision, but this should be a sobering thought for those who are optimistic.

As a result, then, I can say with confidence that Netsuite is not presently generating anywhere near the results they need in order to justify their current market price, and I can recommend them for consideration as a short selling candidate.

0

Good News: China’s a Bubble

November 19, 2010

Hugh Hendry, the hedge fund manager and inflation skeptic whose views I have always found informative and interesting, sat on a panel at a conference last February called the Russia Forum. I finally found footage of the full panel. On the whole, he was his usual opinionated self, but he did shed some light on the China situation. Although the remarks are months old, I think his views are entirely applicable today.

The panel, chaired by Marc Faber, consisted of himself, Nassim Taleb (author of Fooled by Randomness and The Black Swan), Michael Gomez of Pimco, David North of General Investment Management, and Michael Powers of Investec, were asked whether or not China is a bubble. Nassim Taleb, in his usual style, said that if people were looking for the “hot” growing country to invest in in 1900, they would have picked Argentina before the United States and so things are really only obvious in hindsight. Hugh Hendry, more willing to put his sense of pattern recognition where his mouth is, answered a definite yes.

His grounds were that a nation that is simultaneously a large foreign creditor and running a trade surplus comes to a bad end unless one or the other of those things changes. It creates a massive asset bubble that ultimately leads to a deflationary depression. China is in that situation now, he says. Japan was in that same situation in 1990, and, strange though it is to think of the United States as a creditor nation, it was in that same situation in 1929.

Of course, correlation does not imply causation and this could all be an interesting coincidence, but the proposed mechanism makes it a plausible hypothesis. Obviously a nation that is a large foreign creditor and that has a large trade surplus winds up with a huge amount of cash bouncing around its economy beyond what it requires domestically. This creates a pressure on the extra money that should push it back out into the world, as the people of the country spend it on foreign goods and services. Ultimately, this turns the trade surplus into a trade deficit fairly rapidly. If, however, this natural process is obstructed by economic forces or explicit government policy, that money has nowhere to go except into pumping up domestic asset prices.

Although it is further back in history than Hendry would go, Spain and Portugal had a similar problem. Adam Smith records that because of their possession of the very productive gold and silver mines of their American empires, massive amounts of money flowed in. However, mercantilist ideas of the time equated the wealth of a nation with the amount of gold and silver in it, and so the countries banned or imposed an export duty on the two metals. As a result, Smith writes that Spain and Portugal were “the two most beggarly countries in Europe.” Adam Smith likens this process to building a dam; if you dam a river without altering its course in any way, the water will eventually overflow the dam and keep flowing exactly as it did before; there will just be created a lake of liquidity deep enough to drown in.

In the United States, Hendry claims that the gold standard prevented that money from going abroad (and much of Europe at the time had little for the US to purchase), a situation that a modern floating exchange rate would prevent. China, of course, does not have a floating exchange rate. In fact, not only does China use a fixed rate, but it actually forces its exporters to surrender their foreign currency in exchange for yuan at the government’s official rate. That money ultimately winds up in the hands of China’s central bank, which adds it to the bottomless pot of foreign reserves. The alternative, as I stated, is that the exporters could use that money to purchase foreign goods and services that they might actually enjoy. Hendry provocatively describes this policy as turning Chinese citizens into worker ants, and it results in the Chinese working for less than they’re worth, and forced into overpriced real estate, all to feed the current account surplus. He seems to think of it as a financial imperial ambition where China is placing financial global influence over economic stability.

Evidence suggests, though, that this ambition of China is rapidly becoming more trouble than it’s worth. China has (very slowly) been trying to allow the yuan to appreciate, and last August also began to allow exporters to keep some of their  foreign currency holdings offshore, where they would not have to be converted. Be that as it may, asset bubbles are called bubbles, rather than balloons, for a reason. With balloons, the air can be let out in a gradual and controlled process, but bubbles only burst.

Given the fact that China’s is inevitably doomed if they continue their policy, I still don’t know how to respond to Obama’s call for China to liberalize its exchange rate policy. It may be part of a Sir Humphrey-type grand strategy, where Obama is calling for China to liberalize its exchange rate in the hopes that it will force them to dig in their heels and not do it. On the one hand, the principle of self-determination must mean that China has a fundamental right to destroy its economy however it pleases. Furthermore, it would be nice to see one of the United States’ rivals for global supremacy to suffer a setback, and it might result in some recovery of manufacturing in the United States. But on the other hand, recessions have messy unforeseen consequences, and I’m not sure that China would handle widespread civil unrest very well.

Either way, I recall that in the 80s people were worried that Japan had somehow managed to repeal the ordinary laws of economics, when all they had really done was set the stage for a lost decade. One would have thought our own experience with bubbles would have left us more alert for other peoples’.

0

Why I sold Qwest

November 10, 2010

As you may have noticed, the stock market has been doing very well over the last few months, and even my staid old telecoms have been caught in the updraft despite (or perhaps because of) the high dividend payouts. As the entire market now seems to be looking for yields now that cash and most fixed income (not my junk bond recommendations) have anemic yields, and the general trend seems to be for companies to do something with their excess cash other than making capital investments (Qwest has been eagerly buying back its debt), the recent advance in Qwest is unsurprising. Now, many of the talking heads have begun to question whether the rally is stalled and we should all get out (a sure sign that the rally is likely to continue). However, in my view the value of Qwest and CenturyLink have crossed a key valuation threshold.

As I said in my last article about how CenturyLink (then CenturyTel) was buying Qwest for less than its fair value, I calculate Qwest (Q) to be worth about $13 billion based on applying a multiplier of 10x to its average five-year free cash flows to equity of $1.33 million. CenturyLink’s five-year average flows are complicated due to a recent spate of mergers, but I would think that $800 million, or an $8 billion value for the pre-merger company, is not out of the question. The companies estimate that they will gain about $500 million in synergy from the deal, which, capitalized at a multiplier of 10x again, comes to $5 billion. So, $13 billion + $8 billion + $5 billion comes to $26 billion. The combined market caps of Qwest and CenturyLink are now $24.9 billion, within spitting distance of this price.

Now, it is not unusual for a company to swing from below fair value to above it, and so I may see a higher price for Qwest in future. But as a value investor, I am satisfied with buying below fair value and selling at fair value, because at that point there is no advantage in continuing to hold an investment. Furthermore, the case for $5 billion of that value is from synergy, which represents a dangerous assumption.

As was shown in Damodaran’s Investment Fables, an important book that examines the true historical performances and other concerns about various investment strategies, mergers have a mixed record when it comes to enhancing value. The book cites a study that assessed mergers along two lines: 1, Did the return on the amount invested in the merger exceed the acquirer’s cost of capital?, and 2, Did the combined company outperform the competition? Of the 58 mergers studied, 34 failed at least one test and 28 failed both of them. Furthermore, Damodaran concluded that firms that acquire  companies of a similar size has a worse record than firms that acquire smaller firms. In the case of the CenturyLink/Qwest merger, the target, Qwest, is actually bigger than the acquirer by most fundamental measurements. However, the book also claimed that firms that merge to gain economies of scale have statistically greater success than firms that merge to keep their growth streak going in order to impress analysts, which is to be expected. At any rate, it appears that actually realizing synergy from a merger is more difficult than managements and investment banks would have us believe. Therefore, conservatism demands not counting the full value of the synergy (or perhaps even not any value at all) to the combined company.

I cannot say for certain that this current price ($6.93 as of today’s close) is the best price I can get for Qwest (there is, after all, a $1 billion discrepancy between the market cap of Qwest and CenturyLink that will theoretically have to be resolved as the companies are merging roughly as equals), but I can say that it is about the highest price I feel comfortable in getting. As is suggested in Marty Whitman’s Value Investing: A Balanced Approach, sometimes the merger and acquisition market overtakes the ordinary investor market, and we have to take what we can get. In this case, then, the current price of Qwest is about as good as we can get without running the risk of overvaluation and the possible risk of loss that comes with it.

0

River Rock Gaming Authority Bonds are a Good Bet

November 3, 2010

I am pleased to report that my habit of finding investment opportunities that come in pairs is running true to form. I recently recommended the bonds of the Mohegan Tribal Gaming Authority, and now I can follow it up with the bonds of the River Rock Entertainment Authority, which runs a casino in Sonoma County, California, which offer reasonable safety and an unbelievably high yield.

The bonds currently trade at around 84, with a coupon of 9.75%, current yield of 11.7%, and fall due in November of 2011, offering a yield to maturity of roughly 30%. The bonds’ credit rating is B+, ostensibly an improvement from the CCC+ debt that I normally seem to find. The bonds are River Rock’s only long term debt, which prevents us from worrying about issues of subordination or secured versus unsecured. As stated in Steven Moier’s Distressed Debt Analysis, a vitally useful book for investors in junk debt, if there is only one bond issue it is automatically senior and secured.

The issue size is $200 million, and at current prices has a market value of $170 million. The question, then, for the bond investors, is simply whether the entire casino is worth less than the value of these bonds. As we shall see, the financial statements of River Rock indicate that this question is ludicrous.

Revenues at the casino have been on the decline as the economic troubles have been underway, but seem to have stabilized. The casino’s operations have not only covered their interest requirements by a significant margin, but have also allowed the generation of a substantial profit.

In 2007, income was $139 million, operating expenses net of depreciation were $88 million (including an $11 million “credit enhancement fee” to their developer, an obligation that has since been extinguished), producing operating income of $51 million. The gap between depreciation and capital expenditures was $3 million, creating estimated free cash flow of $54 million. Their interest requirement of $21 million was thus covered 2.57x, a safe margin considering the rating of the bonds.

In 2008, income was $140 million, operating expenses net of depreciation were $76 million (the fee owed the developer is conspicuously absent), producing operating income of $64 million. The gap between depreciation and capital expenditures was $4 million, producing operating income of $68 million, which covered their interest requirement by 3.3x. This level of interest coverage is may actually be found in the lower levels of investment-grade debt.

In 2009, income was $124 million, operating expenses net of depreciation were $70 million, producing operating income of $54 million. The gap between depreciation and capital expenditures was $4 million again, producing estimated free cash flow of $58 million. Their interest requirements were covered 2.76x despite what was apparently a difficult year.

In 2010 year to date, income was $65 million for the first two quarters, with operating expenses of $35 million, producing operating earnings of $30 million. Plus a $1 million gap between depreciation and capital expenditures, we have $31 million in operating incomes, with interest covered 2.95x.

You can see what I mean by the absurdity of the question of whether the entire casino is worth less than the bonds. In its worst year, the casino could boast $58 million in free cash flow to the firm. The value of its debt, $200 million, then, is less than four times its yearly free cash flow, a remarkably safe proposition. (By way of comparison, Bon-Ton department stores bonds, another junk bond I liked, had a debt/free cash flow ratio of about 10 when I bought it).

So, then, what is the source of the market’s skepticism? Most value investors have given up on determining why the market does what it does, but identifying the factors is still worth considering. First of all, there is a proposal to build a new casino between River Rock’s current location and the San Francisco Bay Area. River Rock reports that this casino is still in the planning and permitting stage, but if it is ultimately approved and built, it would perhaps affect River Rock’s profitability in a few years’ time. This fact might make it difficult for River Rock to refinance its bonds in November of 2011. Furthermore, River Rock reported in its 2009 10-K that its plans to renovate and expand have been put on hold for want of financing, which no doubt is weighing on the market perceptions as well. Also,  the casino transfers at least $11 million to the Tribe every year, and these payments, although they rank below the bonds in priority, might well be regarded as sacrosanct. However, this distribution is well covered by the casino’s operations after interest.

I think the main reason, though, is that the balance sheet is apparently not in good shape, containing a large entry for “construction in progress” and showing hardly any equity at all even taking the construction in progress into account. However, earnings power should guide the balance sheet, not the other way round. The casino also has $35 million in cash on the books, so it may be that River Rock will not have to roll over the full amount.

Moreover, in the unlikely event that River Rock were unable to refinance these bonds, the market would be in uncharted territory, as no Indian casino has ever tested the bankruptcy courts. Obviously, the traditional workout of the bond holders stepping up to become new equity holders is unavailable because only an Indian tribe can hold an interest in an Indian casino. However, the alternative of foreclosure and liquidation is not feasible, because the property is useful only as a casino, really, and given its current profitability there would be no reason to pursue this course. So, as no stakeholder in the casino has any reason to see its operations terminated, even in the unlikely event that the debt could not be rolled over, a workout would ultimately be fairly painless.

So, based on the above figures I can state that River Rock gives every appearance of being able to handle the interest on its current bonds and give assurance to the new debtholders when the time to roll the issue over comes that they can service their debts. As a result, I think the large discount and consequent high yield to maturity are a market anomaly that will likely be corrected, to the profit of everyone who buys at the current price.

9