How badly do taxes stifle GDP growth?
I noticed on Yahoo! finance a couple of days ago that Paul Otellini, CEO of Intel, publicly complained that, owing to high taxes and regulatory uncertainty, innovation and growth in the US would be stifled and, of course, Obama is to blame.
Of course, this would be the same Intel that paid AMD a $1.25 billion settlement over antitrust violations, settled claim with the FTC a couple of weeks ago over its anticompetitive activities, and is still fighting off a $1.45 billion claim in Europe. Of course, antitrust laws have been on the books for more than a century (and were invented by Republicans), so if the CEO hasn’t quite got the hang of complying with them after all this time, then his complaints come off as a case of sour grapes to me.
He did also state that we have to look forward to “an inevitable erosion and shift of wealth.” Now, it is only natural for a business to want less regulation, and of course it is natural for everyone to want to pay less taxes. But these comments got me thinking of how strong the relationship is between taxation and growth, particularly now that the Bush tax cuts are due to expire.
The job of an economist, it has been said, is to take something that works in practice and make it work in theory. The author of that statement may have intended it as a satire, but it is actually a remarkably accurate description. And in theory, too high a level of taxation on production forces economic participants to direct more and more of the nontaxed remainder of their economic activity towards immediate consumption rather than the building up of capital, and also makes certain marginal uses of capital economically unattractive, causing its owners to leave it idle or consume it. And without capital there can be no growth.
So, that is the hypothesis that economists and CEOs have set up for us: more taxes = less growth. Fortunately, we have a way to test this hypothesis, as the government, thanks in part to the taxes it collects, has given us a wealth of data on historical GDP levels, and also of taxes collected as a portion of GDP. With these two pieces of data, we can test the hypothesis.
If, as it is stated, more taxes = less growth, then we should see lower growth in a period where taxes as a portion of GDP are high, and higher growth in a period where taxes as a portion of GDP are low, and using the elementary statistical analysis technique of regression, we can calculate the r-squared, the coefficient of determination, which will tell us how accurately the data fit the theory. An r-squared close to 1 means that there is perfect correlation, and an r-squared close to 0 means that there is no correlation.
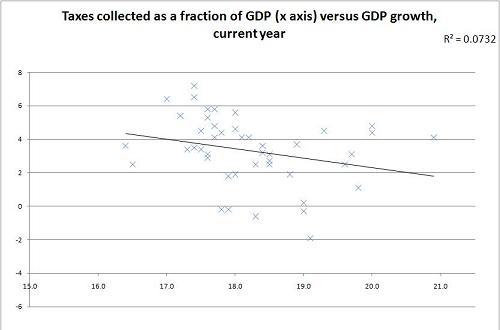
The most basic mode of analysis is to compare the taxes collected in a given year with GDP growth that year. Using a linear regression function and taking data since 1963 (a year I chose more or less arbitrarily) up until 2007, it gave me the formula of y = 13.73 – .56x, , where y is GDP growth and x is the level of taxation as a portion of GDP. Now at first glance the hypothesis is correct; every 1% increase in taxation as a percentage of GDP results in GDP growth that year dropping by .56%. However, would you care to know what the r-squared was? .07. Remember how I said that an r-squared close to 0 suggest complete randomness? So in theory, tax levels explain 7% of GDP growth (the other 93% are explained by something else), but with an r-squared that low, I am forced to question the validity of the expression itself.
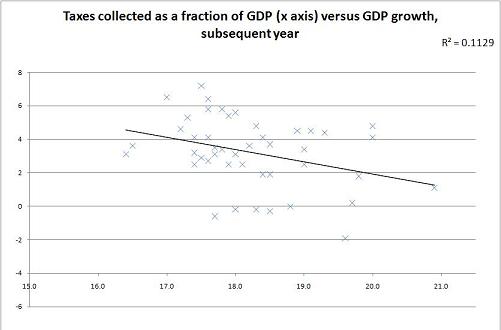
But since I have the data I may as well play with it. After all, very often one only knows one’s tax liability after it’s too late to change it, and one just has to adjust in future periods accordingly. So it would perhaps be more fair to look at the taxes collected in one year and the effect on growth for the next year. Here I get a more dramatic looking equation, y = 16.49 -.72x, but again my coefficient of determination is only .11, meaning, depending on interpretation, that my equation has an 11% explanatory power, or that there’s only an 11% chance that I’ve discovered anything at all.
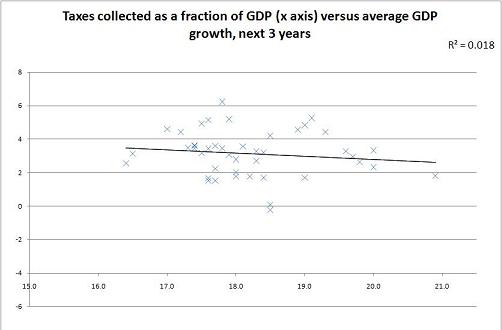
But while I’m at it, I recall that capital and consumption decisions are often made with more than a year of time horizon. From that perspective, it would probably be more enlightening to compare taxes collected in one year with GDP growth over the next three years. This time I get y = 6.59 -.19x, and my r-squared is only .02. So in fact what logic suggests would be a clearer relationship is actually the more tenuous one, as the r-squared suggests that the odds are very good that the relationship is nonexistent.
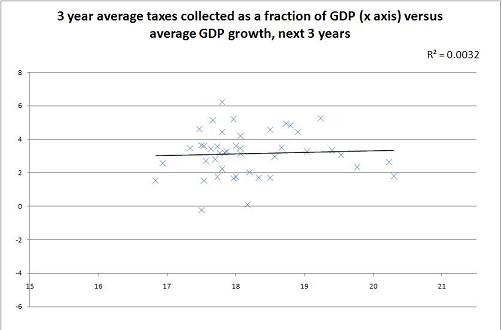
And finally, I am reminded that capital is a thing that accumulates over time based on previous consumption and savings decisions, so in the interest of thoroughness as well as symmetry, I compared average taxation as a percentage of GDP over the last three years to average GDP growth over the next three years, and I was amazed at what I found. y = 4.34 + .09x, indicating that paradoxically, higher tax collections over a three-year period actually lead to higher growth over the next three years. It made no sense to me, until I consulted the r-squared figure, which was .003, meaning pretty much conclusively that there was no detectable correlation at all.
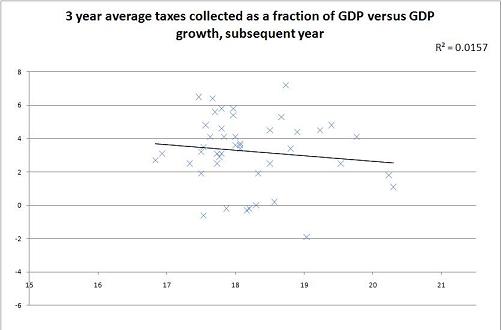
And just to finish out the available set of comparisons, calculating the effect of three-year average tax collections on growth in the subsequent year produces an r-squared of .016, no better than most of the other experiments and also far below a level of significance necessary to conclude that a correlation exists.
So, the upshot of this fairly basic analysis is that no matter how you slice the data, it seems that tax levels (at least the tax levels that have prevailed in the US since 1963) have an undetectable effect on GDP growth, if indeed they have any at all, and that therefore GDP growth must come from other factors.
I am aware that since the data for taxes as a portion of GDP has only one decimal, it is entirely possible that I have two GDP growth figures for a single level of tax, so this method could be criticized that if one line has to go through two points on the same point on the x axis, it is inevitable that it can only be close to one of them. However, I would counter these critics by asking why, if tax levels have a strong explanatory power, would the two growth points be far away from each other in the first place.
It may further be objected that taxes and GDP growth are a chaotic and nonlinear system, and so the use of a linear regression would not be reasonably calculated to produce a good fit. But a cursory visual examination of the raw data indicates that there is no obvious cluster, and using the other regression tools available in Excel produce no improvement.
So, it seems, based on this simple analysis, that cutting taxes as a portion of GDP has a poor record in producing near-term growth, and so the perennial push to make further tax cuts in order to juice economic growth would appear misguided. But on the plus side, the impending expiration of the Bush tax cut is equally unlikely to strangle an economic recovery, as many people have feared.
Leave a Reply